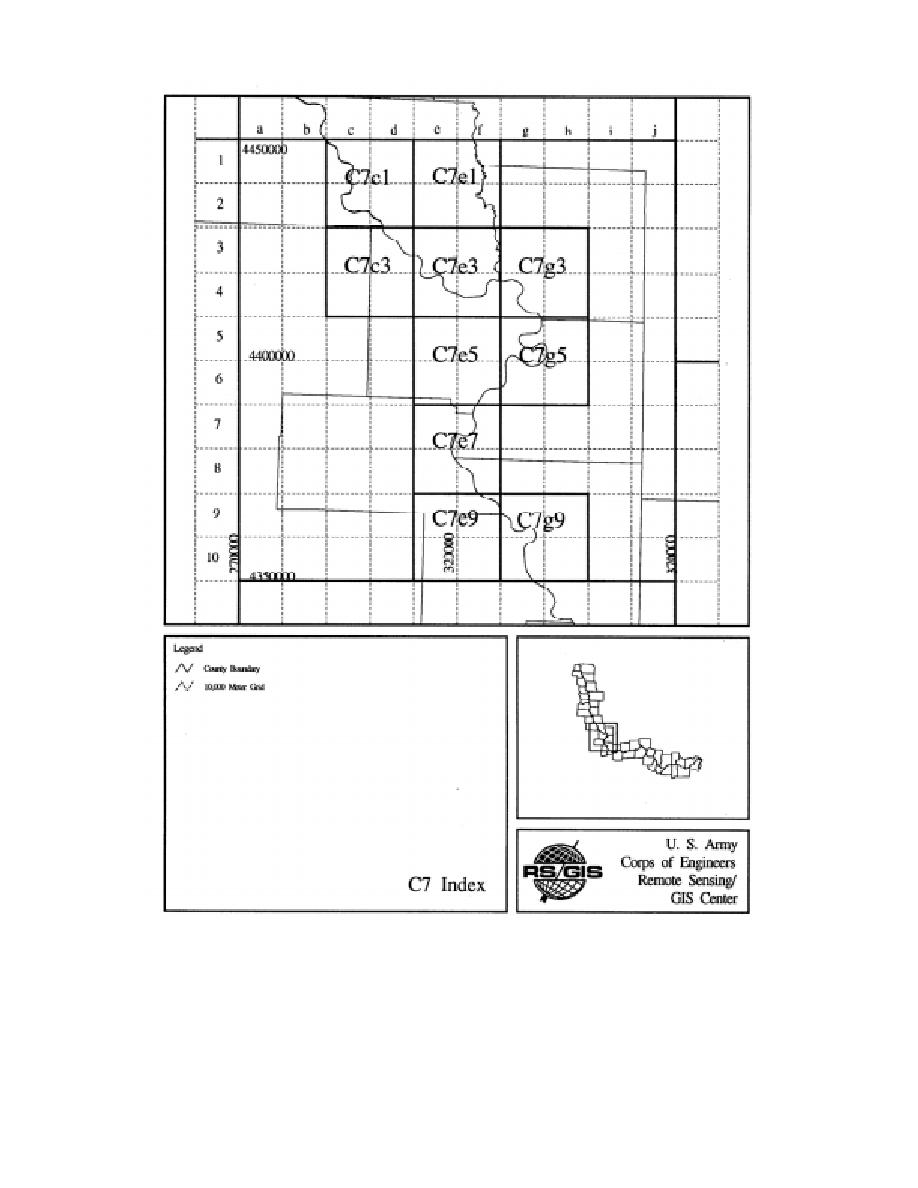
Figure 4. Index map for section C7, Missouri River, showing county boundaries, 10,000-m UTM
grid and 20,000- 20,000-m boxes. The projection is UTM zone 15.
8.5- 11-in. page, the 20,000- 20,000-m maps
The notebook was then divided into sections
for each of these 100,000- 100,000-m regions. At
were generated at a scale of 1:133,333. The roads
the beginning of each of these sections, an indexed
and railroads were drawn in black with the same
map of the 100,000- 100,000-m region shows the
line style to place more emphasis on the hydrog-
20,000- 20,000-m regions that were actually
raphy, which was drawn in blue, and inundation
mapped (Fig. 4 and 5). Because of the size of the
data, which, when available, were drawn in red.
9


 Previous Page
