6
4
2
0
12
24
36
48
60
72
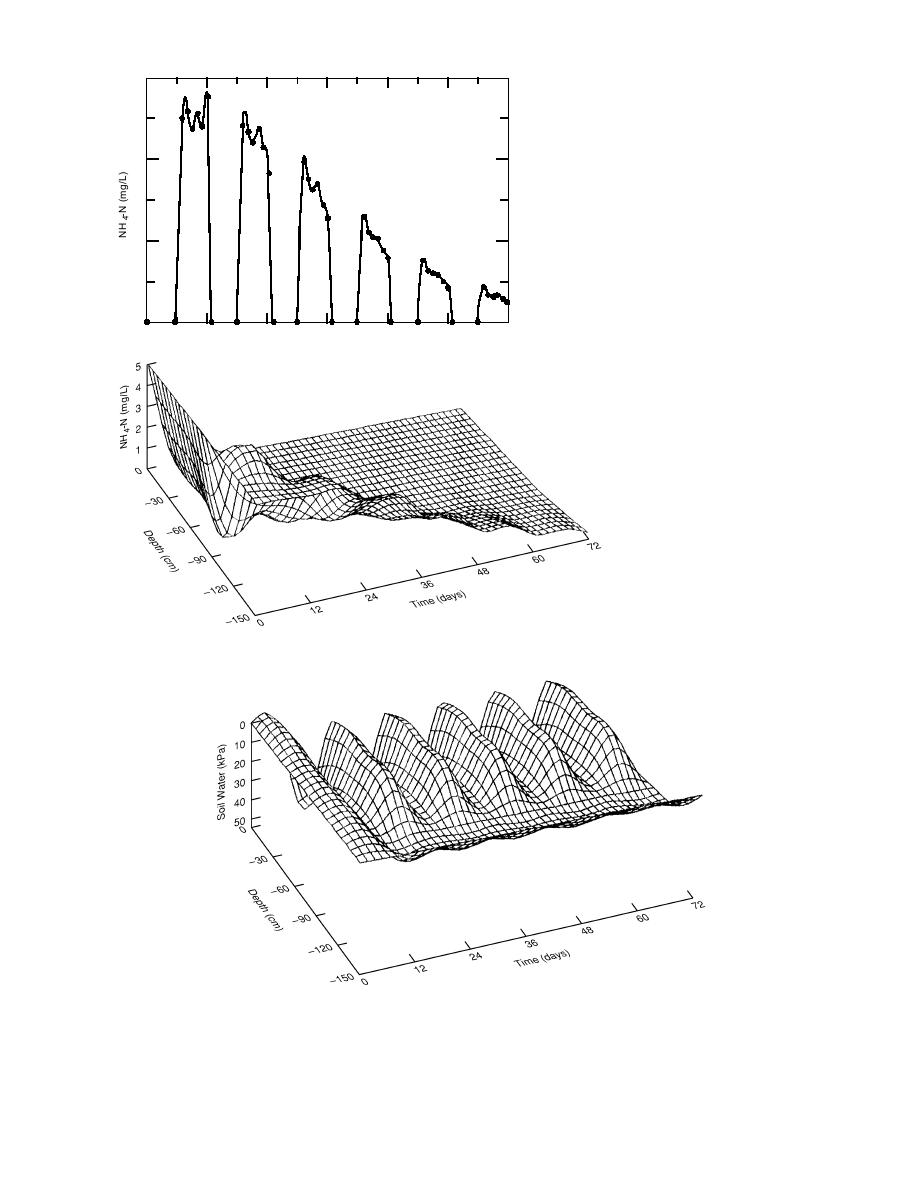
a. NH4-N efflux from the soil profile.
Time (days)
b. NH4-N distribution in the soil profile.
Figure 6. NH4-N assuming a uniform initial concentration of 5 mg NH4-N/L and no transformations.
Figure 7. Soil-water potential distribution. Zero kPa indicates complete pore-
space saturation.
8


 Previous Page
