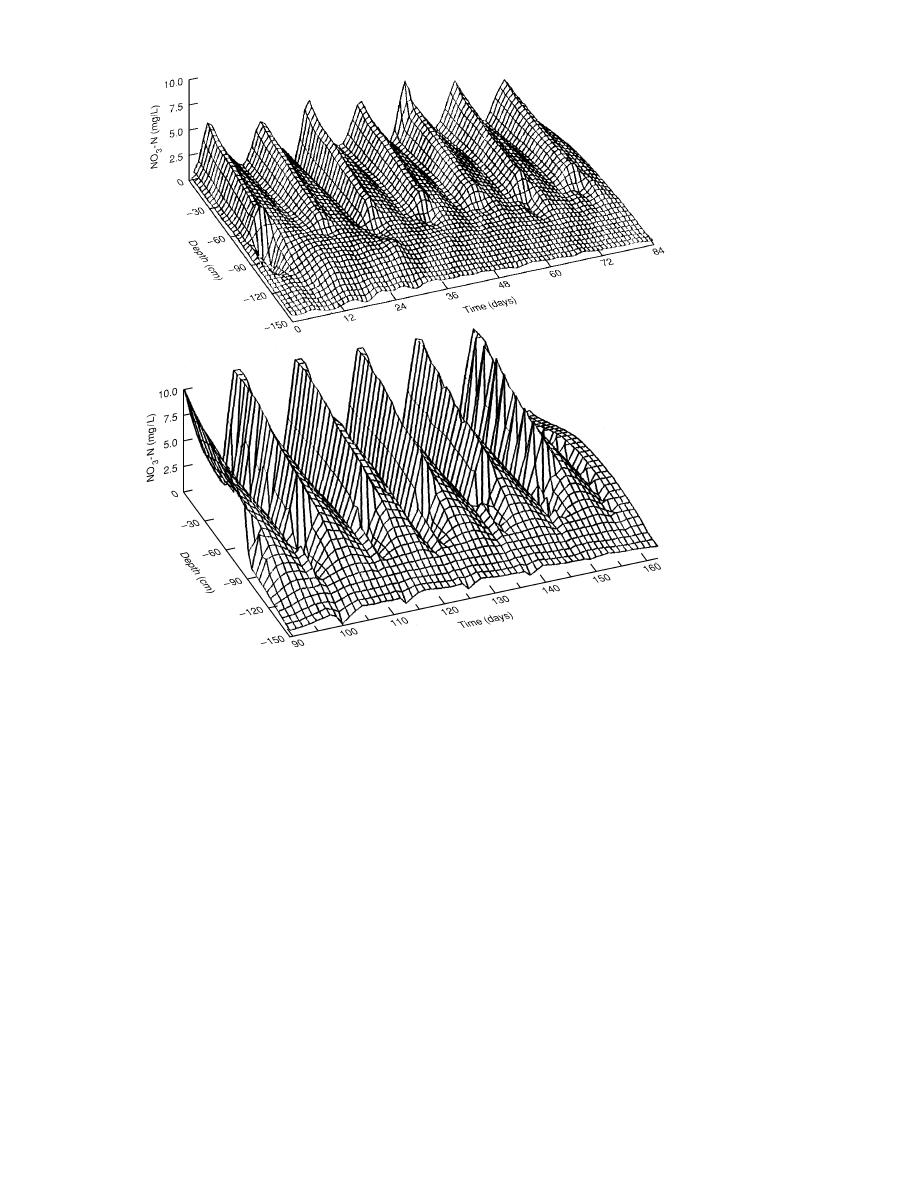
a. 4 mg NO3-N/L applied.
b. 10 mg NO3-N/L applied.
Figure 5. NO3-N in the soil profile.
erage velocity of water movement. More-
Denitrification was based on first-order ki-
over, denitrification would be promoted by
netics and moisture content. The relatively
saturated conditions.
conservative denitrification rate used was
0.01 hr1.
The soil was assumed to have three layers
within the profile.
The soil-water characteristics for the simu-
Results
lation were described using an equation de-
Figures 47 show the output from these sim-
veloped by Green and Corey (1971) and us-
ulations. The concentration values for the output
ing coefficients from Windsor sandy loam
were derived using the same technique as used in
soil, B horizon, which is similar to the soil at
the short-term simulations. The WASTEN model
the Fort Dix site.
simulations indicated that, under the conditions
The plant uptake and evapotranspiration
used for the computer simulations, the NO3-N con-
were set to zero. Ultimately these two pro-
centrations in the soil solution leaving the upper
cesses will tend to reduce N levels in the soil,
150 cm of the soil profile would not exceed 2.0 mg/
either by direct uptake or by increasing the
L. This was true for both application rates: 4.0 and
conditions that promote denitrification. Set-
10.0 mg/L NO3-N in the wastewater (Fig. 4a and
ting coefficients for evapotranspiration and
b). Additionally, NO3-N output following 168 days
plant uptake of N forces the model to as-
of treatment (seven cycles each of 4.0 and 10.0 mg/
sume that N not lost by denitrification will
L NO3-N in the wastewater) showed NO3-N efflux
be lost as NO3-N leachate.
below 2 mg/L NO3-N (Fig. 4c).
7


 Previous Page
