3
ment on the projected soil profile efflux NO3-
N concentration levels at the site. Additionally,
the wastewater dosages were changed to more
accurately reflect those intended for the site.
The simulations were continued until the long-
2
term trend of the NO3-N outflow was discern-
ible. The input data more accurately repre-
sented the proposed soil renovation treatment
for wastewater:
1
The loading rates for nitrogen were
based on either 4 or 10 mg NO3-N/L in
wastewater and approximately 104 cm
of wastewater applied per cycle. These
two N concentrations were used to rep-
0
12
24
36
48
60
72
84
96
Time (days)
resent the design- and worst-case N lev-
els in the effluent. (Earlier simulations
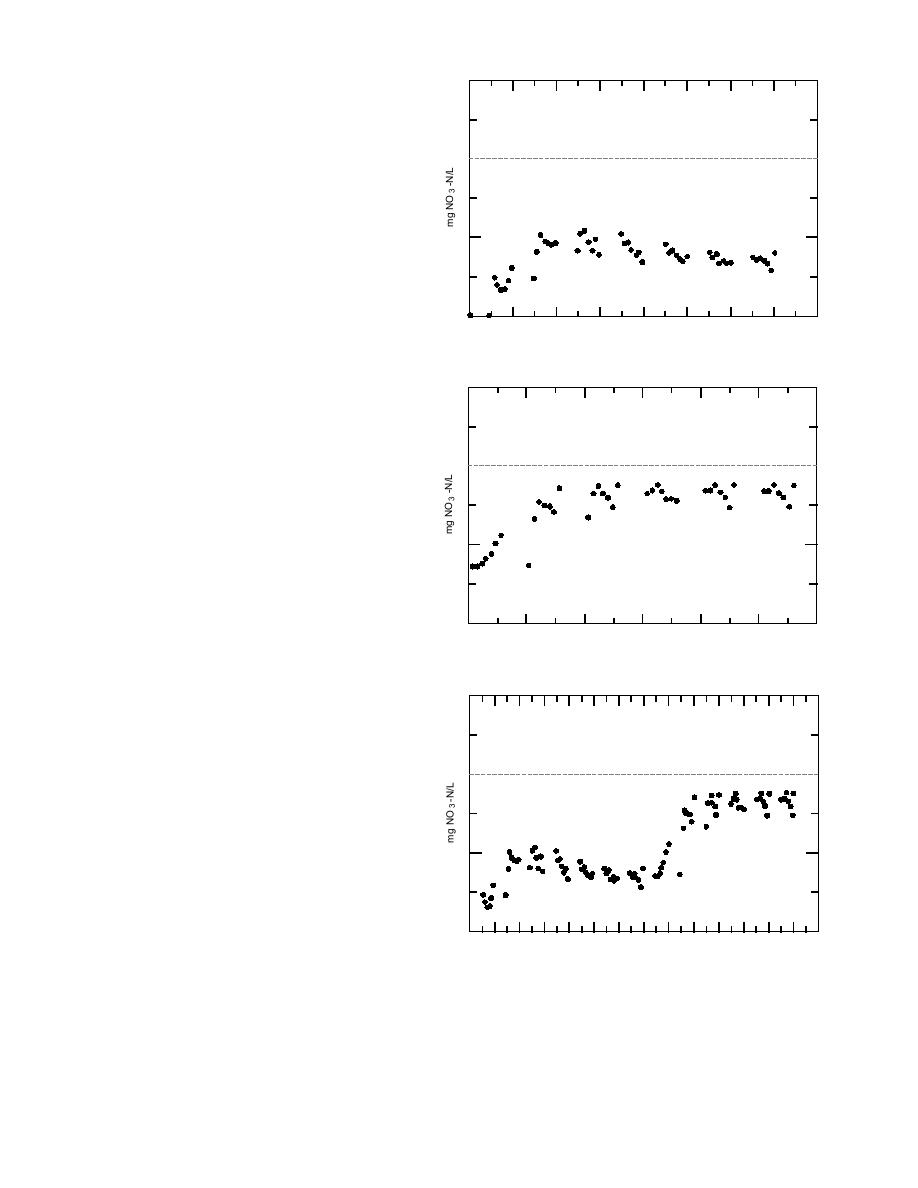
a. 4 mg NO3-N/L applied.
used 4 mg NO3-N/L at a depth of 21 cm.)
The application volume (ponding depth)
3
was determined from a loading rate of
4.6 million gallons/day for two consecu-
tive days, on an 8-acre surface (two cells,
each having an area of 4 acres). The ap-
2
plication was followed by a 10-day rest.
From the data provided by the Philadel-
phia District of the Corps of Engineers,
an initial concentration of 0.5 mg NO3-
1
N/L was assumed in the entire soil pro-
file.
The simulations were conducted for
seven 12-day cycles with 104 cm of 4 mg
NO3-N/L applied each cycle, and also
0
12
24
36
48
60
72
five 12-day cycles with 104 cm of 10-mg
Time (days)
NO3-N/L wastewater applied each
b. 10 mg NO3-N/L applied.
cycle.
Additionally the two simulations were
3
run sequentially, with applications of 4
mg NO3-N/L followed by a series of
applications of 10 mg NO3-N/L.
The initial ammoniacal N was assumed
2
to be 5.0 mg/L NHx-N, based on data
provided by the Philadelphia District of
the Corps of Engineers.
The following input data and assumptions
1
were the same as those used for the earlier
simulations. As stated before, these are conser-
vative assumptions and estimates, represent-
ing worse-than-expected conditions.
The soil depth to the water table was set
0
108 120 132 144 156
168
12
24
36
48
60
72 84 96
at 150 cm (4.9 ft), which is conservative.
Time (days)
Temporary water table mounding dur-
c. Days 189, 4 mg NO3-N/L in wastewater; days 90156, 10
ing infiltration could conceivably raise
mg NO3-N/L in wastewater.
the water table significantly for short
periods. This effect would most likely in-
Figure 4. NO3-N efflux from the soil profile during wastewater
crease denitrification by reducing the av-
application (12-day cycles).
6


 Previous Page
