1994 Arctic Ocean Section
120
10 nautical miles during the
transect. Often the ice con-
centrations were overesti-
100
mated, since the farther one
looks towards the horizon,
80
the less open water can be
seen. When the ship is pro-
gressing slowly through a
60
vast old ice floe, for example,
AES
85 GHz
from the ship the ice con-
NASA
Visual
40
centration could appear to
210
215
220
225
230
Julian Day
be 100%.
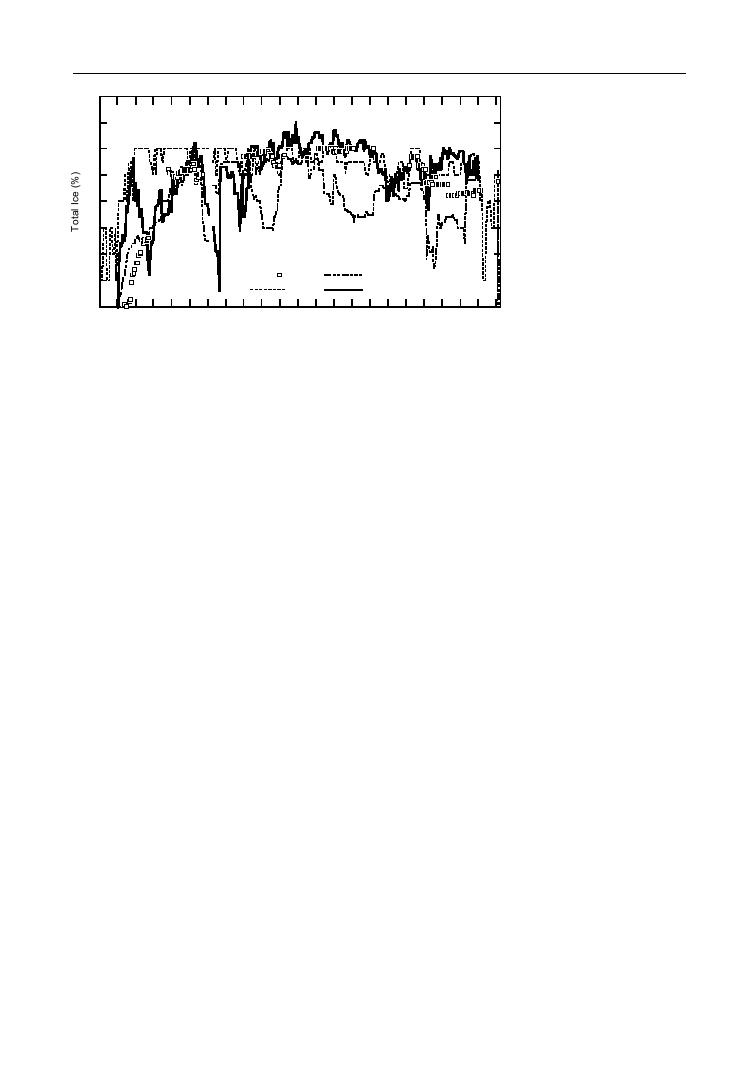
The total ice concentration along the ship's track was derived from each of
Ice concentration
along the Polar
the algorithms and estimated from visual ice observations. The average visually
Sea's track to the
estimated ice concentration was 93% along the total ship's track (A.R. Engineer-
North Pole.
ing, and Science and Technology Corporation 1994). The AES and 85-GHz algo-
rithms show an average of 88% and 84%, respectively; the NASA team algo-
rithm, which appears to underestimate the ice concentration, averaged 78%.
The microwave sensors are influenced by cloud liquid water content and
snow wetness, which cause an increase in the brightness temperature detected
by the sensors. The NASA Team and AES algorithms, using the lower frequen-
cies, are less sensitive to atmospheric moisture than the 85-GHz algorithm.
The derived ice concentrations are significantly affected by the snow wetness,
however (Garrity 1991, 1992). For example, the 85-GHz derived ice concentra-
tions can be as large as 110%. When using the 85-GHz algorithm over regions
of lower ice concentration, the reference polarizations in a given image must
be chosen with care because there the polarization-based algorithm is more
sensitive to cloud opacity and can easily and substantially underestimate the
ice concentration (Lubin et al. 1996). However, near the ice edge, the 85-
GHz derived ice concentrations were closer to visual observations than the
conventional algorithms were, most likely due to better resolution. Compari-
son of 85-GHz brightness temperatures measured from space with both the
lower-frequency measurements and with the shipboard observations shows
that much of the information about surface properties, including snow wet-
ness and volume scattering in multiyear ice, is contained in the 85-GHz sig-
nal, despite the higher atmospheric opacity.
Using the 85-GHz algorithm, ice concentrations greater than 100% are re-
duced to 100% and a colored ice map is produced for operational use. The influ-
ences of the atmosphere and snow wetness on derived ice concentrations are
less than 10% for the high ice concentrations encountered during AOS-94, so
this is not a critical problem. For determining total ice concentration during sum-
mer in the high Arctic, the new 85-GHz algorithm is as good as the conventional
lower-frequency algorithms, if not better because of the doubled resolution.
98


 Previous Page
