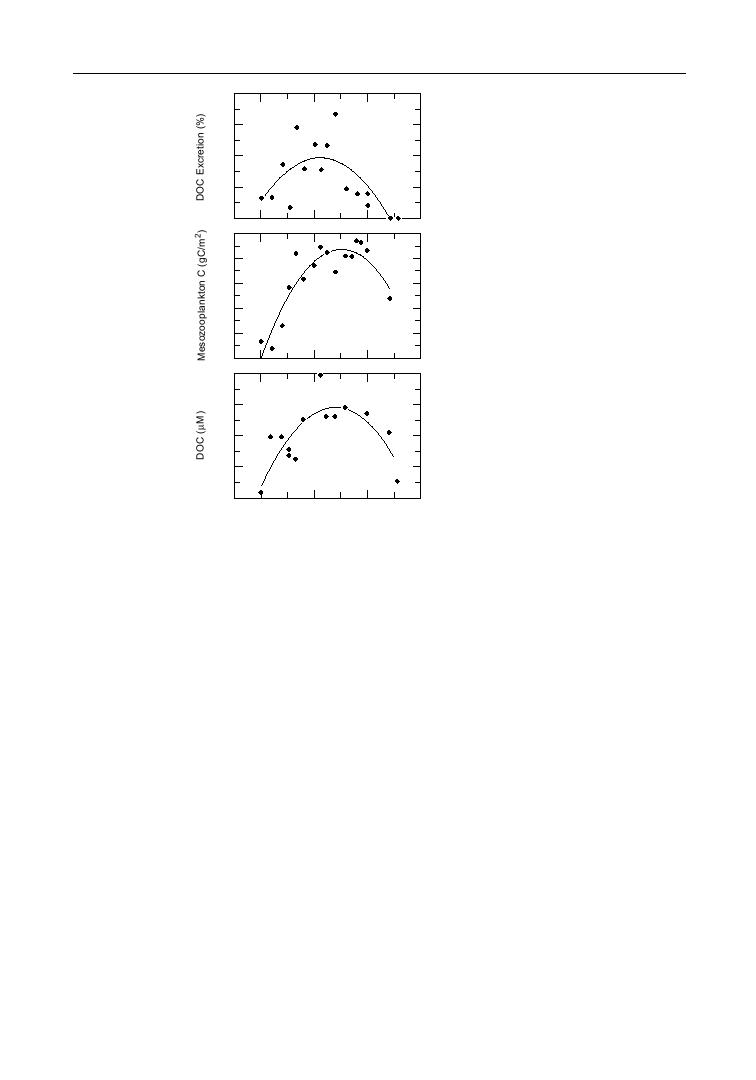
1994 Arctic Ocean Section
80
a
60
40
a. Percentage of the phytoplankton produc-
20
tion released as extracellular carbon, meas-
ured by Michel Gosselin.
0
2.0
b
1.6
b. Zooplankton standing stocks for 0100
m. Zooplankton were collected in vertical
1.2
net tows (200 mm mesh, 0.75 m opening),
0.8
dried onboard ship, weighed and then ana-
lyzed for carbon with a CHN analyzer. The
0.4
curve is a second-order regression with r 2 =
0.834.
0
140
c
120
c. Dissolved organic carbon in the surface
100
water. Samples were collected in duplicate
and stored frozen with no preservative. The
80
curve is a second-order regression with r 2 =
0.634.
60
70
80
90
80
Latitude (N)
DOC and standing stocks vs. latitude.
of surface water in the central Arctic is about 10 years, some portion of the
DOC is being recycled many times.
Previous studies of the Arctic Ocean carbon cycle assumed that, since produc-
tion appeared to be low in the central basins, most organic carbon was either
derived from river inputs or imported from the extensive shelf regions. Our
new measurements of primary production, bacterial production and zooplank-
ton standing stocks suggest a more dynamic carbon cycle in the surface waters
of the central Arctic. Higher estimates of primary production result from the
activity of ice algae, which were not sampled in previous studies. Direct meas-
urements of DOC excretion by both ice algae and phytoplankton indicate that
at least a portion of the high DOC found in the central Arctic is produced in
situ. Measurements of rates of bacterial production indicate a significant turn-
over of DOC in the central Arctic. High standing stocks of mesozooplankton
are further evidence for significant cycling of organic carbon in the upper 100
m of the central Arctic. Primary production by the ice algae and the produc-
tion of DOC in the central Arctic both appear to be key processes in the Arctic
carbon cycle. Our results indicate that the central Arctic is not a biological
desert but rather supports an active biological community that contributes to
the cycling of organic carbon through dissolved and particulate pools.
36


 Previous Page
