EM 1110-2-2907
1 October 2003
such are leaf shape, overall plant structure, and moisture content. The spacing or
vegetation density and the type of soil adjacent to the plant will also create varia-
tions in the radiance and will lead to "pixel mixing." Vegetation density is well
defined by the near infrared wavelengths. Mid-infrared (1.5 to 1.75 m) can be
used as an indication of turgidity (amount of water) in plants, while plant stress
can be determined by an analysis using thermal radiation. Field observations
(ground truth) and multi-temporal analysis will help in the interpretation of plant
characteristics and distributions for forest, grassland, and agricultural fields. See
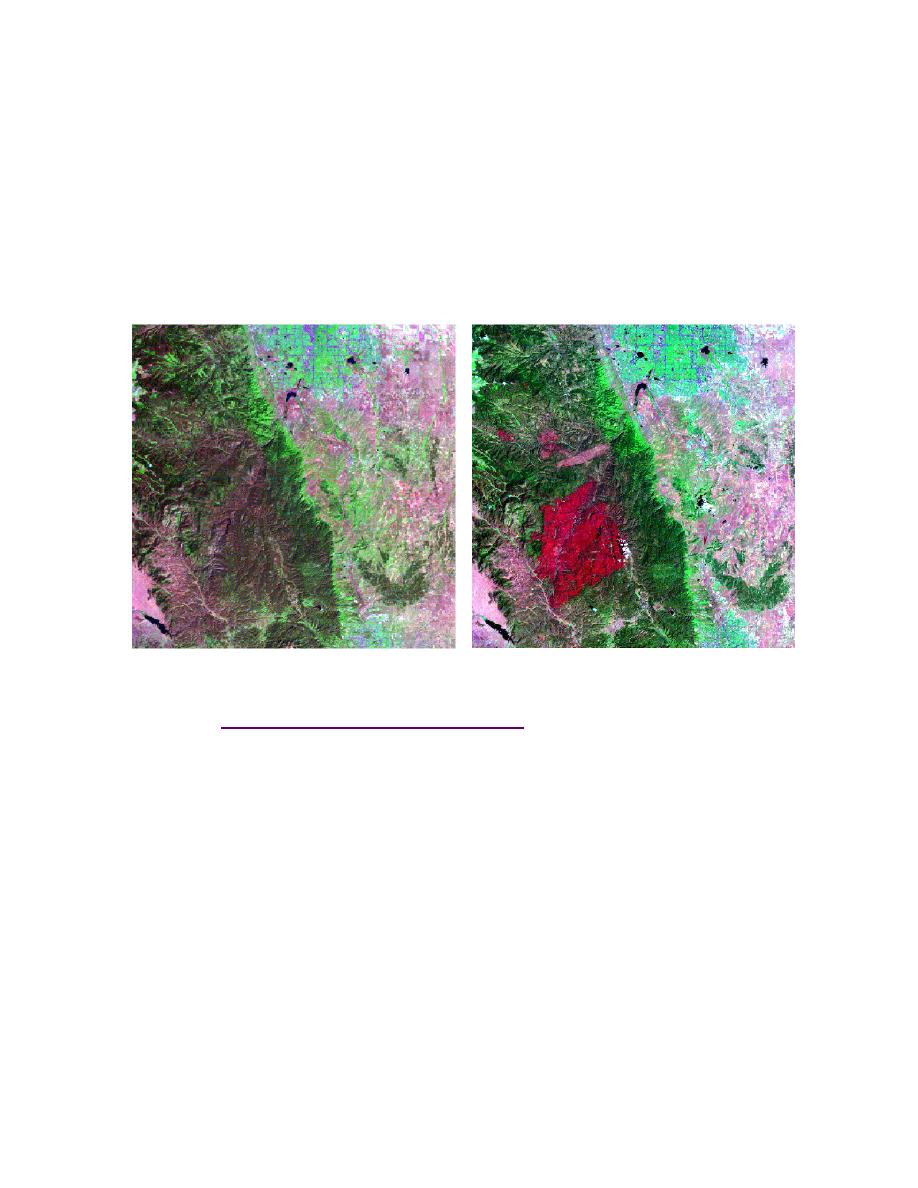
Figures 5-28 and 5-29.
Figure 5-28. Forest fire assessment using Landsat imagery (Denver, Colorado). Image on
the left, courtesy of NASA, was collected in 1990; image on the right was collected in 2002
(taken from http://landsat7.usgs.gov/gallery/detail/178/). Healthy vegetation such as forests,
lawns, and agricultural areas are depicted in shades of green. Burn scares in the 2002 im-
age appear scarlet. Together these images can assist forest managers in evaluating extend
and nature of the burned areas.
(b) Exposed Rock (Bedrock). Ground material such as bedrock, regolith
(unconsolidated rock material), and soil can be distinguished from one another
and distinguished from other objects in the scene. Exposed rock, particularly hy-
drothermally altered rock, has a strong reflectance in the mid-infrared region
spanning 2.08 to 2.35 m. The red portion of the visible spectrum helps delineate
geological boundaries, while the near infrared defines the landwater boundaries.
Thermal infrared wavelengths are useful in hydrothermal studies. As discussed in
earlier sections, band ratios such as band 7/band 5, band 5/band 3, and band
3/band 1 will highlight hydrous minerals, clay minerals, and minerals rich in fer-
rous iron respectively. See Figure 5-30.
(c) Soil. Soil is composed of loose, unconsolidated rock material com-
bined with organic debris and living organisms, such as fungi, bacteria, plants,
etc. Like exposed rock, the soil boundary is distinguished by high reflectance in
5-48


 Previous Page
