EM 1110-2-2907
1 October 2003
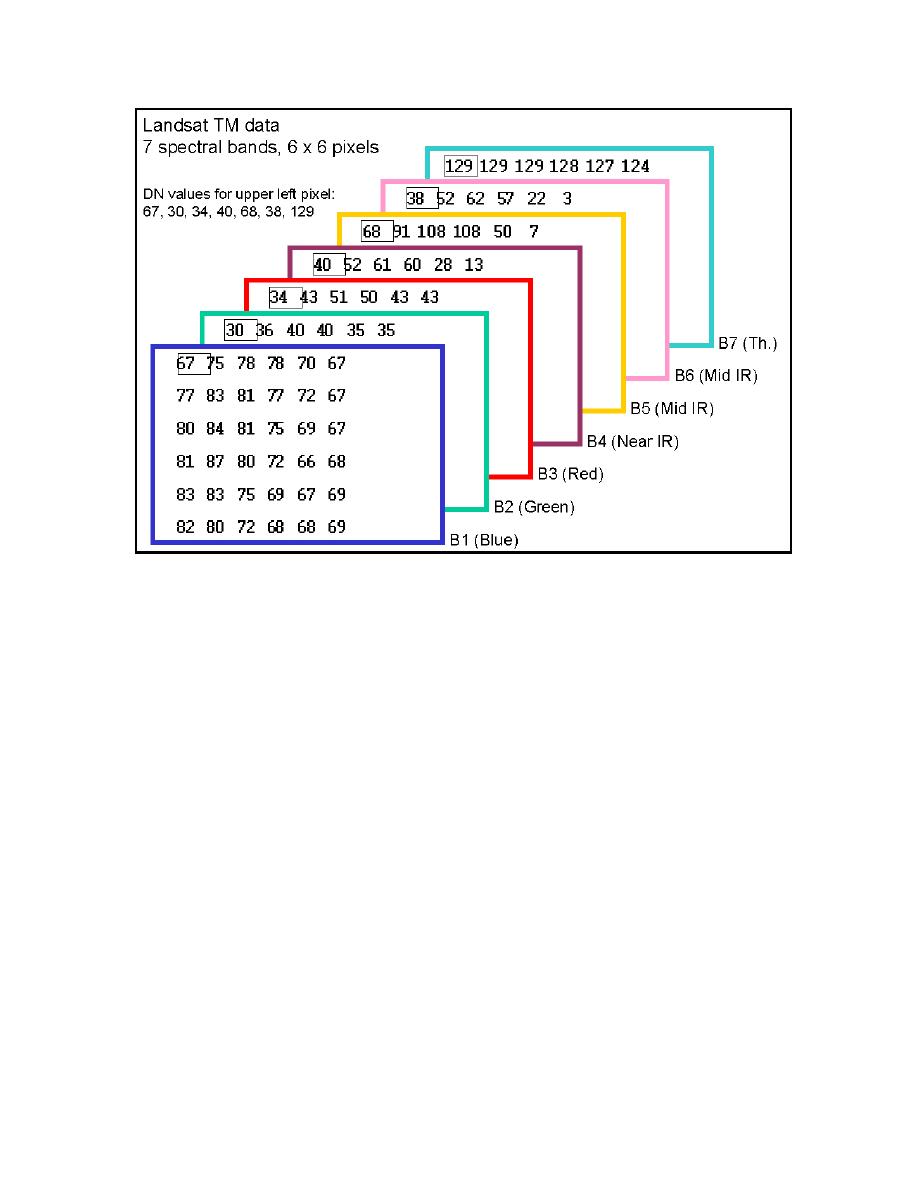
Figure 2-31. Individual DNs can be identified in each spectral band of an image. In this ex-
ample the seven bands of a subset from a Landsat image are displayed. Image developed
for Prospect (2002 and 2003).
(2) When displaying an image on a computer monitor, the software allows a user to
assign a band to a particular color (this is termed as "loading the band"). Because there
are merely three possible colors (red, green, and blue) only three bands of spectra can be
displayed at a time. The possible band choices coupled with the three-color combinations
creates a seemingly endless number of possible color display choices.
(3) The optimal band choice for display will depend of the spectral information
needed (see Paragraph 2-6b(7)). The color you designate for each band is somewhat ar-
bitrary, though preferences and standards do exist. For example, a typical color/band
designation of red/green/blue in bands 3/2/1 of Landsat displays the imagery as true-
color. These three bands are all in the visible part of the spectrum, and the imagery ap-
pears as we see it with our eyes (Figure 2-32a). In Figure 2-32b, band 4 (B4) is displayed
in the red (called "red-gun" or "red-plane") layer of the bands 4/3/2, and vegetation in the
agricultural fields appear red due to the infrared location on the spectrum. In Figure 2-
32c, band 4 (B4) is displayed as green. Green is a logical choice for band 4 as it repre-
sents the wavelengths reflected by vegetation.
2-37


 Previous Page
