EM 1110-2-2907
1 October 2003
P
Figure 2-6. Frequency (ν) refers to the number
of crests of waves of the same wavelength that
pass by a point (P) in each second.
(3) Speed of electromagnetic radiation (or speed of light). Wavelength and fre-
quency are inversely related to one another, in other words as one increases the other de-
creases. Their relationship is expressed as:
c = λν
(2-1)
where
c = 3.00108 m/s, the speed of light
λ = the wavelength (m)
ν = frequency (cycles/second, Hz).
This mathematical expression also indicates that wavelength (λ) and frequency (ν) are
both proportional to the speed of light (c). Because the speed of light (c) is constant, ra-
diation with a small wavelength will have a high frequency; conversely, radiation with a
large wavelength will have a low frequency.
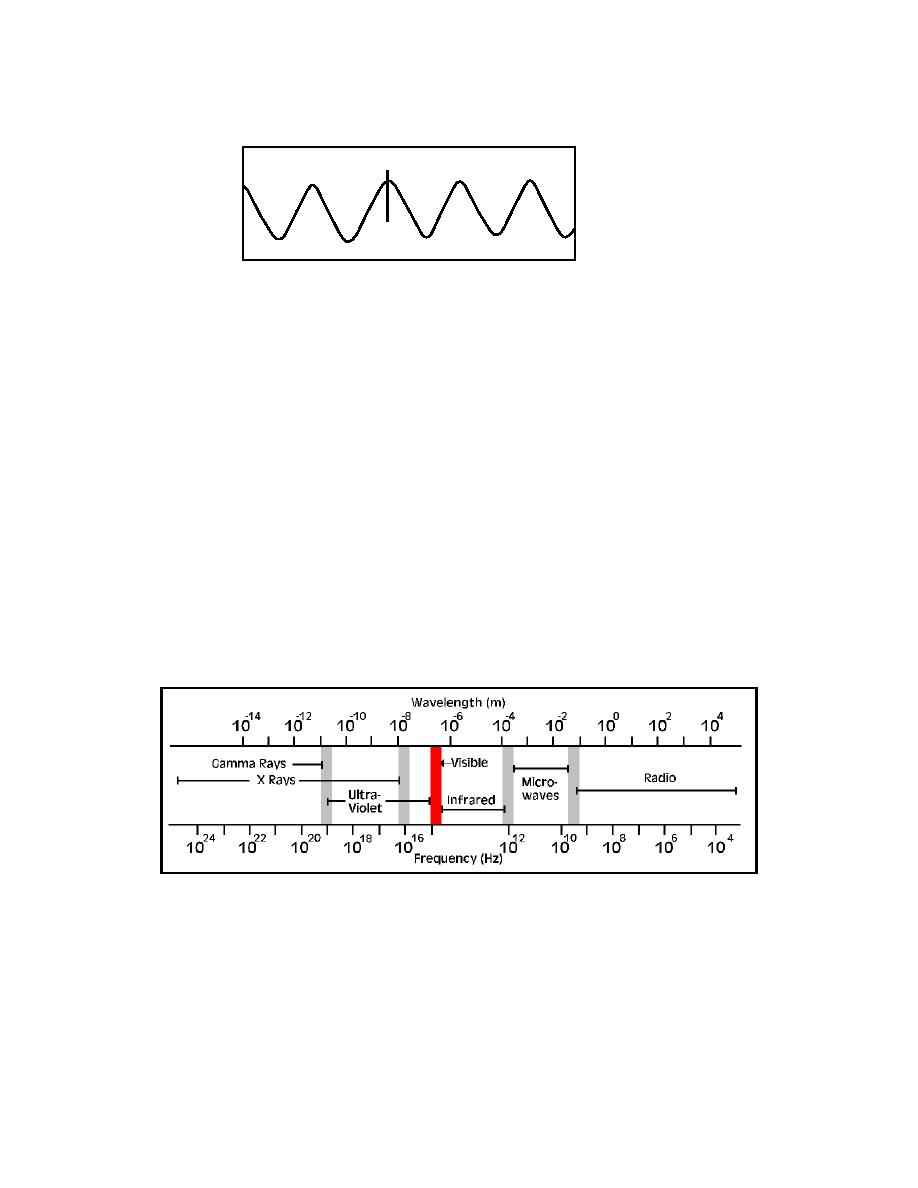
Figure 2-7. Electromagnetic spectrum displayed in meter and Hz units. Short
wavelengths are shown on the left, long wavelength on the right. The visible spec-
trum shown in red.
g. Electromagnetic Spectrum. Electromagnetic radiation wavelengths are plotted on a
logarithmic scale known as the electromagnetic spectrum. The plot typically increases in
increments of powers of 10 (Figure 2-7). For convenience, regions of the electromagnetic
spectrum are categorized based for the most part on methods of sensing their wave-
lengths. For example, the visible light range is a category spanning 0.40.7 m. The
2-6


 Previous Page
