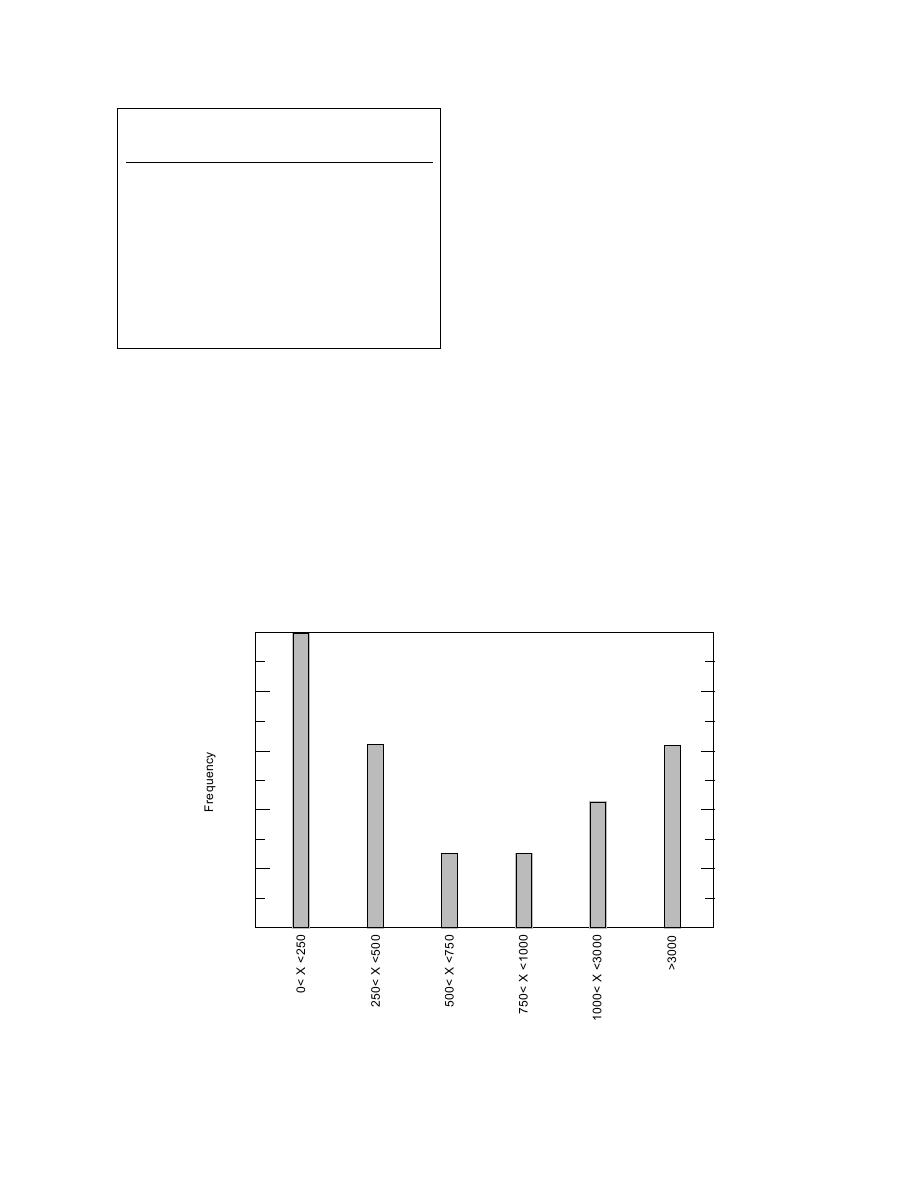
cating the breakdown of lengths posted.
Table 1. Types of restrictions specified by state
Only a few states estimated road maintenance
DOTs.
costs/mile and road maintenance savings/mile by
imposing load restrictions. Estimates of savings
Total shutdown.
were as high as a few hundred thousand dollars
Speed limit restriction (speed unspecified).
per mile. This adds up to millions of dollars per
Load limit (load unspecified).
year per state. From the point of view of road main-
6 and 7 tons (5.4 and 6.3 metric tons) per axle.
tenance agencies, load restrictions are unquestion-
6 tons per single axle and 7 tons per tandem axle.
11 tons (10 metric tons).
ably cost effective. However, local economy is
Half the legal load limit.
adversely affected.
High enough to accommodate school buses.
Figure 4 shows a breakdown of methods used
Over 15 tons (13.6 metric tons): total shutdown.
615 tons: load limited to the product of 300
for determining when to impose and when to
remove load restrictions. More than half of the
the sum of inches of the width of all tires.
responding states that post load restrictions use
subjective techniques, such as observation, to both
surfaced roads are not typically under state
place and remove load restrictions. Many of these
jurisdiction; therefore they are posted by towns,
states indicated that they post restrictions only
counties, or another responsible agency. Types of
after the first signs of springtime pavement dis-
restrictions varied considerably. A list is provided
tress are observed. By doing this, some damage is
in Table 1.
being allowed. Many also indicated that their pref-
A total of 3420 miles of gravel-surfaced road
erence would be to switch from current reactive
were reported as posted, and a total of 34,800 miles
methods to more quantitative methods (such as
of asphalt-surfaced road were reported as posted.
using a falling weight deflectometer [FWD]) if
Although 10 states indicated that they post chip-
adequate resources were available. Twenty-four
seal surfaced roads, no states provided estimates
percent of responding DOTs currently use quan-
of miles posted. Figure 3 shows a histogram indi-
titative methods (e.g., FWD, frost tubes, or thaw
5
4
3
2
1
0
Length (miles)
Figure 3. Breakdown of lengths of asphalt roads posted by state DOTs.
4


 Previous Page
