30
The bottom half of each chamber was packed with
the clean moist soil by adding 1.0 cm of soil at a time,
packing it down, then scoring the soil surface before
25
adding the next layer. Thermocouples were placed in
Air 2
the center of each chamber and packed into the soil at
Air 1
approximately 12 cm and 8 cm (0.5 cm below the fro-
20
zen layer boundary) from the top of the chambers. After
the bottom half of each chamber was finished, the soils
15
were frozen.
Chamber 1
Chamber 2
Once the soil in the bottom was frozen, soil was
Chamber 3
packed into the top half of each chamber. Chambers 1
Chamber 4
10
and 3 were packed with clean soil, and Chambers 2
T1
and 4 were packed with contaminated soil. The filtered
end of the outlet tube was packed in the soil just above
5
the frozen layer. Thermocouples were packed into the
T2
soil at about 7 cm (0.5 cm above frozen layer bound-
0
ary) and 3 cm from the top.
T3
The freezing coil bath was set to a temperature of
T4
10C to freeze the soil to a temperature of about 2 to
5
3C. Soil temperatures in the bottom of each chamber
Sample,
Samples
Finish
Start
fell below zero after approximately 3.5 days and
remained at 2 to 3C for four days. When the unfro-
10
0
20
40
60
80
100
zen top soil layer was added, the bottom soil warmed
Day of the Experiment
to above freezing except for the very bottom layer
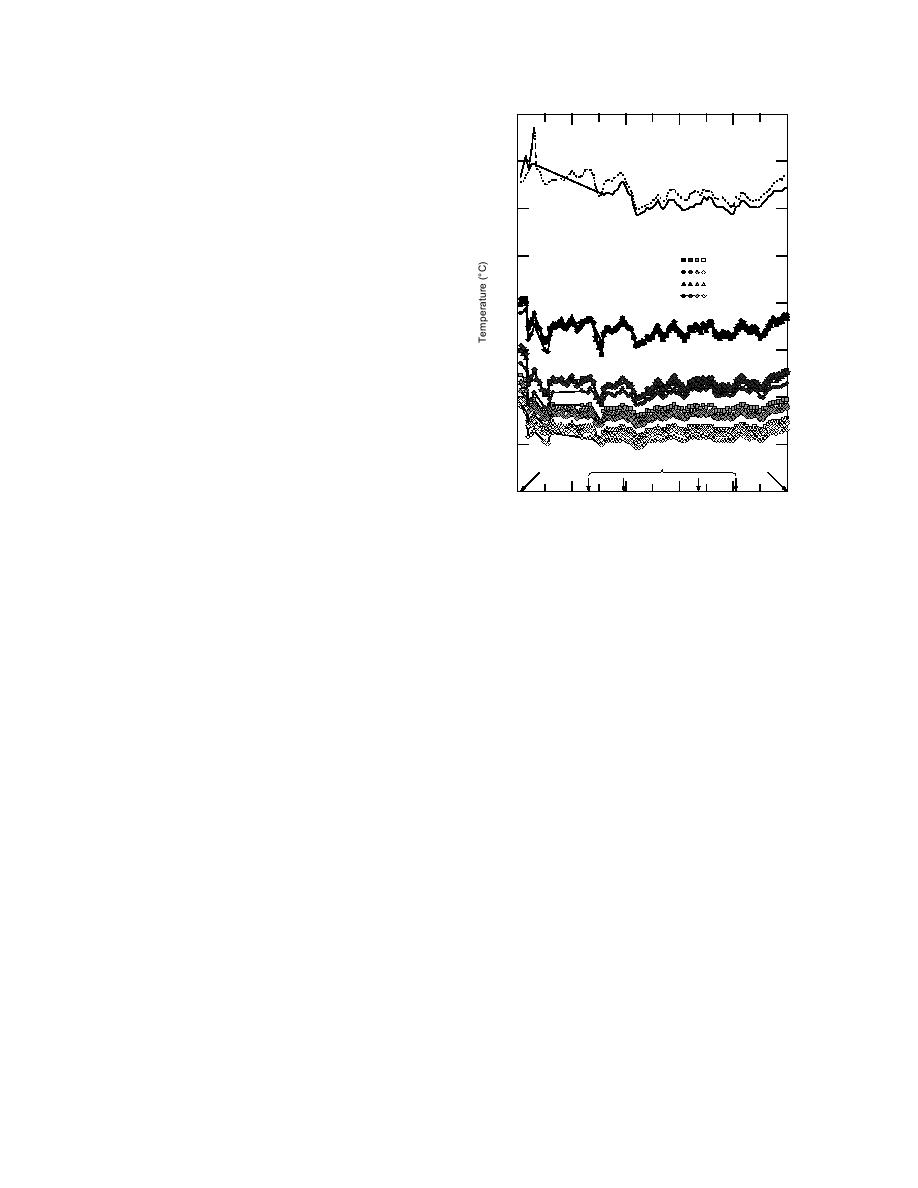
Figure 2. Temperatures measured in room air and
(below 12 cm) and remained above freezing for approx-
in chambers during the experiment.
imately three days. To bring temperatures back down
to about 3C, the bath was turned down to 15C.
were extracted from above the frozen soil barrier
through a filter on the bottom of the outlet. Samples
were collected on Days 26, 39, 67, 81, and 100 (Fig.
Temperature measurements
2). Each time that solution was collected for analysis
Temperature data were recorded continually through-
of explosives, a new volume of solution was added to
out the experiment using two Omnidata Recorders
the soil. Sampling dates, as well as volumes added and
beginning on Day 1. One recorder was used for Cham-
removed, are reported in Table 3.
bers 1 and 2; the other for Chambers 3 and 4. Each data
logger recorded temperatures for the four thermocouples
Chamber soil sampling
packed in each chamber plus a thermocouple sitting on
At the end of the experiment, the chambers were
the benchtop to monitor air temperatures. The average
sampled by removing the soil in layers. Eight soil lay-
of 15-minute readings was recorded every two hours
ers were collected: four layers each from the top and
until the end of the experiment on Day 100. In addi-
bottom halves of the chambers (Fig. 1). The soils were
tion, temperatures were monitored and recorded in the
removed by carefully scraping out from the top down
laboratory notebook daily. Because of problems with
using a ruler to guide the removal. Two subsamples of
the data logger for Chambers 1 and 2, continual read-
each soil layer were analyzed for air-dried moisture
ings were not recorded from Day 1 to Day 32; however,
content and subsequently analyzed for concentrations
the daily checks provided values for comparison to
of explosives.
continual readings for Chambers 3 and 4.
Chemical analyses
Solution sampling
If necessary to bring samples into the concentration
The initial volume of solution was added to the
range of the standards, aqueous solutions of explosives
chambers on Day 13, two weeks after the chambers
were diluted with Milli-Q water. Then they were fil-
were packed with soil. The aqueous explosives solu-
tered through a 0.5-m filter into sample vials prior to
tion was added to the clean soil, and distilled water was
analysis.
added to the contaminated soil by slowly dripping the
Explosives were extracted from soil samples follow-
solutions into the top of each chamber through an inlet
ing the SW-846 Method 8330 for RDX and TNT
(Fig. 1).
(USEPA 1994), and Thorne and Jenkins (1995) for pi-
Using a hand pump attached to the outlet, solutions
3


 Previous Page
