0
1
2
3
4
5
6
7
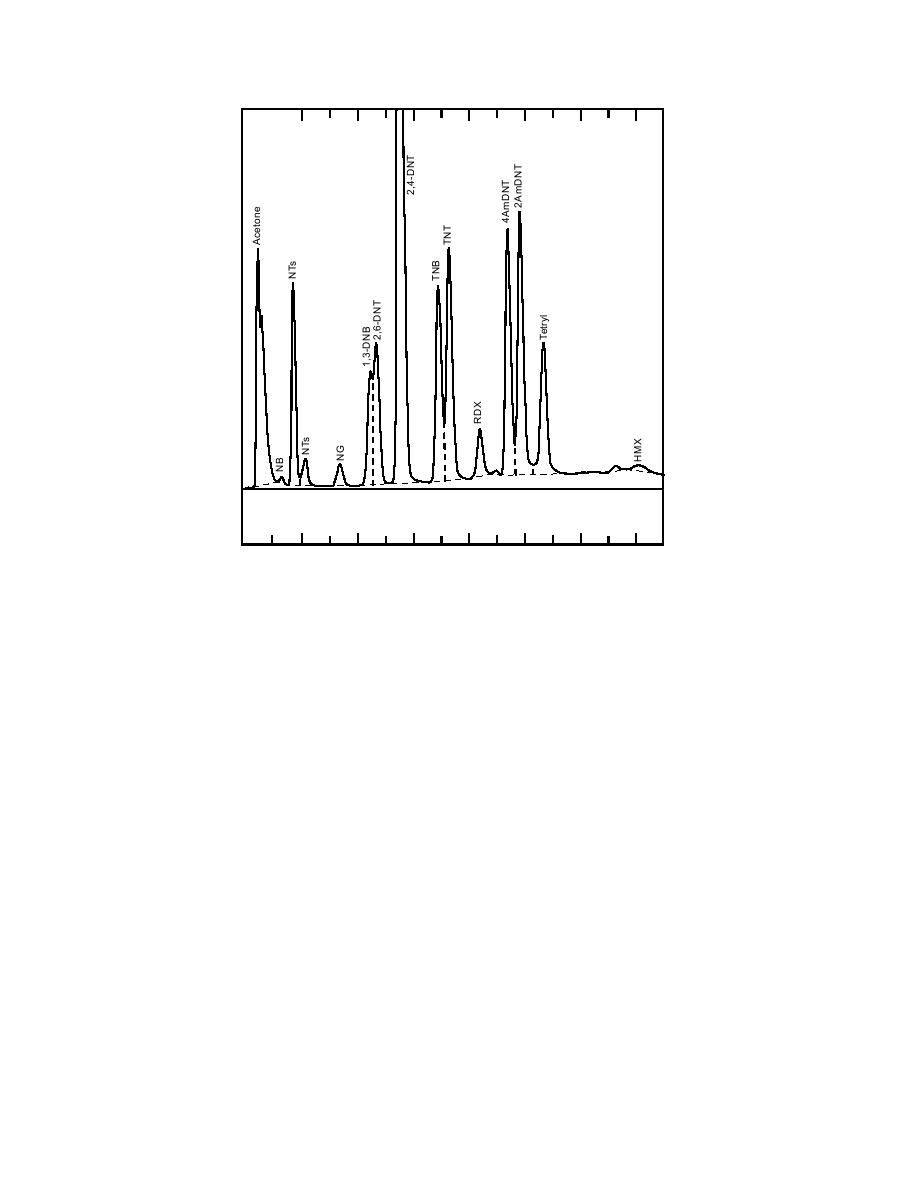
Figure 2. GC-TID chromatogram of 40 mg/L of the 8330 analytes and
200 mg/L of NG. Note: NTs--ortho, meta, and para nitrotoluene.
FIELD STUDIES
syringe and filtered by passing through a 25-mm Millex
SR (0.5-m) filter that was attached via a Luer-Lok
Fort Leonard Wood
fitting. The filtered extract was directly transferred to a
The first field trial was performed at Fort Leonard
2-mL amber deactivated glass vial.
Wood, Missouri, on April 1719, 2000. At this site the
Instrument calibration
objective was to rapidly establish the presence of ex-
plosives residues in soil samples collected near buried
With the exception of HMX, a five-point calibra-
land mines. Previously it had been observed that 2,4-
tion curve was used for each trial and responses were
DNT, TNT, 4AmDNT, and 2AmDNT were detectable
based on peak heights. This number of standards al-
in soil samples collected above and near some of the
lowed nonlinear models to be used when necessary. A
land mines that contained TNT as the main explosive
nonlinear model (quadratic through the origin) was
charge (Jenkins et al. 2000). When these analytes were
chosen when the linear regression through the origin
detected in surface samples, the analyte concentrations
failed to establish a correlation coefficient (r) of greater
were typically in the low (<100 g/kg) parts-per-bil-
than 0.990. Continuing calibration checks were made
lion range. During this field trial the GC-TID was set
after every five samples by randomly running one of
on a folding table inside of a building that was adjacent
the four highest standards. If the calibration model failed
to establish a concentration within 20% of the expected
to the minefield. The calibration standards used ranged
in concentration from 5 to 100 g/L for 2,4-DNT, TNT,
value for a standard, recalibration was performed. The
and 2AmDNT, and from 20 to 400 g/L for 4AmDNT.
concentration range used for calibration curves was
Duplicate, co-located soil samples were collected at
selected based on the instrumental response to specific
every sampling location following the description given
analytes, range of linearity, and the analytical objec-
by Jenkins et al. (2000). One of the sample duplicates
tives. Because of the poor sensitivity for HMX, a lin-
was analyzed on site and the other was returned to the
ear model calibration that was based on three of four
Cold Regions Research and Engineering Laboratory
points (Hewitt and Jenkins 1999) was used.
4


 Previous Page
