containing significant quantities of sand compared to
L
other aggregates. For example, a 45-kN (10-kip) load
D
D
C
was applied at 690 kPa (100 psi) to a subgrade through
various aggregates, with the result that the stress reach-
ing the subgrade through a 0.6-m (24-in.) layer of sand
B
was about twice that of the stress through a layer of
914 mm (36 in.)
crushed limestone (Herner 1955). Sowers and Vesic
to Next Wheel
A
A
A
A
(1962) found that vertical stresses in a 203-mm- (8-
in.-) thick base consisting of 95% subangular quartz
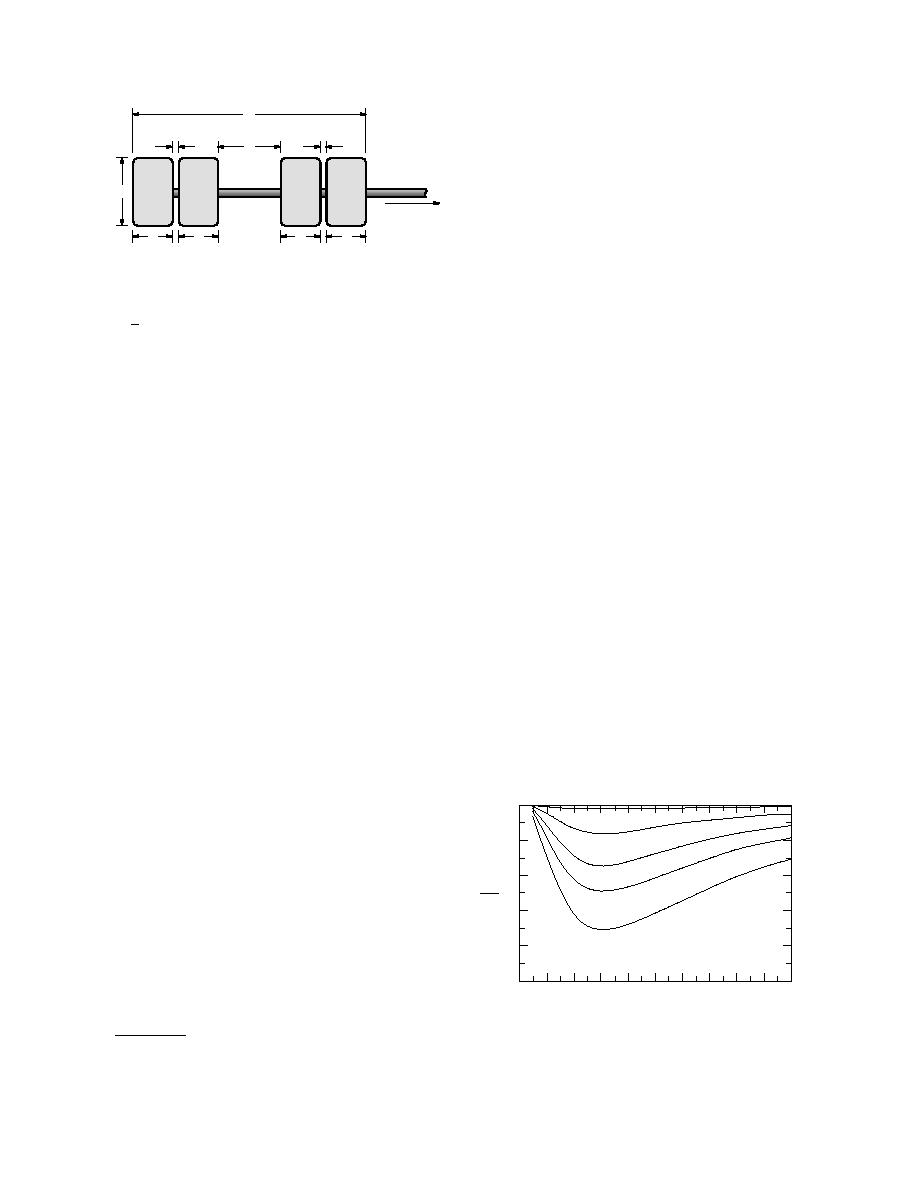
A = 178 mm (7 in.)
sand and 5% asphalt, overlain by a 152-mm- (6-in.-)
B = 305 mm (12 in.)
thick asphalt pavement, were up to 70% higher than
C = 305 mm (12 in.)
D = 85.7 mm (3.375 in.)
the vertical stress predicted by Boussinesq and higher
L = 3.9
than that in other types of base--many of which had
B
lower vertical stresses than those predicted by
Boussinesq. Thus, more effort should focus on accu-
Figure 4. Dimensions of wheels on one end of an
axle line of the M1000 trailer.*
rately modeling stress distribution through the vari-
ous aggregates that the military may use, indeed may
DISCUSSION
be forced to use, in constructing geotextile-reinforced
unsurfaced roads.
Based on the results of the analytical study, there is
no compelling reason to assume any wheel load shape
CONCLUSION
other than circular. However, if a vehicle does produce
wheel loads than can be approximated as uniformly
loaded rectangles with length/width ratios of about 4
For all wheeled U.S. military vehicles, the wheel
or greater, this question should be reconsidered for pur-
load may safely and accurately be assumed to be cir-
poses of modifying design guidance that may be too
cular if the aggregate that is loaded can be modeled as
conservative. In this case, the spreadsheet shown in
a linearly elastic material (e.g., compacted, crushed
Appendix A can be used to calculate the stress reduc-
rock). Because the U.S. Army design procedure to use
tion at depth below the rectangle simply by changing
geotextiles overlain with high-quality aggregate to sta-
the F value that is input at the top of the spreadsheet.
bilize low-bearing-capacity soil for trafficking with
Keep in mind that this approach assumes that the
wheeled vehicles (U.S. Army and U.S. Air Force 1995)
Boussinesq stress distribution provides a reasonable
assumes that the wheel load applied at the surface is
estimate of vertical stress at depth (i.e., the aggregate
in the shape of a circle, no changes are required in this
behaves in a linearly elastic manner and the stress is
approach to modeling wheel loads. However, if a ve-
uniformly applied).
hicle does produce loads than can be approximated as
Although not the topic of this study, whether the
uniformly loaded rectangles with length/width ratios
aggregate that is placed on top of the geotextile behaves
of about 4 or greater, (e.g., tracked vehicles) this ques-
as a linearly elastic material is important; related to this
is whether the vertical stresses are accurately predicted
1.0
by the Boussinesq method. The aggregate type and qual-
L:B = 1
ity significantly influence the stress distribution at depth.
0.9
L:B = 2
McMahon and Yoder (1960) found that pressures in
homogeneous, compacted clay soil subgrades followed
L:B = 3
0.8
the Boussinesq pattern, but were up to 18% higher than
I rect
I circ
L:B = 4
those predicted by Boussinesq at shallow depths (e.g.,
0.7
less than the diameter of the loaded area). Further, the
L:B = 6
presence of compacted crushed limestone base above
0.6
the clay subgrade reduced the vertical stresses in the
subgrade immediately below the interface to values less
0.5
0.0
0.2
0.4
0.6
0.8
1.0
1.2
1.4
1.6
1.8
2.0
than those predicted by Boussinesq. Other research in-
Normalized Depth, z
dicated that there is a stress concentration in soil layers
Figure 5. Ratio of the reduction in applied stress
with depth for a unit rectangle to a unit circle for
*Personal communication with R. Dunbar, Test Director,
various length/width (L:B) ratios of the rectangle.
Yuma Proving Grounds, Yuma, Arizona, 1999.
4


 Previous Page
