uted over a rectangle (Fig. 4). Based on the informa-
y
tion given in Figure 4, the L:B ratio of the uniformly
loaded rectangle is approximately 3.9. Note that for a
1-m depth of aggregate, V is equal to 1.16 for this ve-
hicle.
r
x
ANALYTICAL STUDY AND RESULTS
I programmed eq 2 and 3 into a Mathcad 8 pro-
z
grammable worksheet (Mathsoft 1998) and set the area
r
tan1 z
of pressure application equal to one. The results gen-
erated include the fraction of the applied vertical stress
below the rectangle and the circle, Irect and Icirc, respec-
tively, and the ratio Irect/Icirc. A factor F represents the
L:B ratio that was easily changed to examine its influ-
ence on results. Appendix A contains a hard copy of
the Mathcad worksheet used, tabulated results, and a
copy of the Mathcad worksheet for the reader's use.
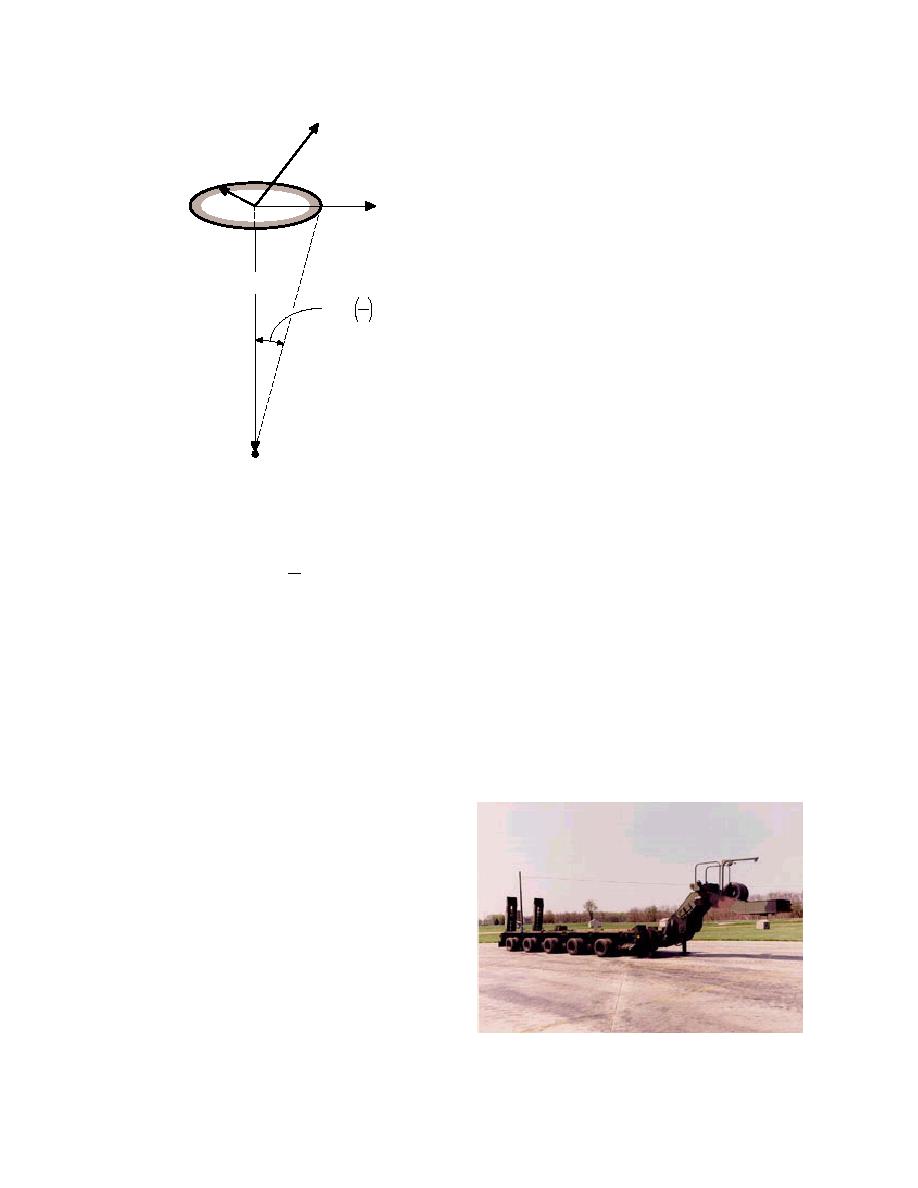
The ratios of the stress reduction beneath the center
Figure 2. Uniformly loaded circle,
of the rectangles to the stress reduction beneath the
showing notation used in the esti-
center of a circle are shown in Figure 5. The maxi-
mation of vertical stress at depth
mum vertical stress beneath the circle is always greater
below the center of the circle.
than that beneath the rectangles, including the special
case of a square. A circle minimizes the ratio of perim-
3
r
eter to area; thus, the circle maximizes the influence
Ic = 1 - costan -1
Z
.
(3)
of surface pressure at depths below the center. There-
fore, applying the assumption that the surface load is
I used eq 2 and 3 for a unit uniform load and a unit
circular is conservative compared to assuming other
area to compare the stress reduction at various nor-
shapes. Furthermore, for length/width ratios of 3 or
malized depths estimated by each equation. I varied
less, the maximum vertical stress applied by a rect-
the length/width ratio of the rectangles from L = B to L
angle is at least 85% of that applied by a circle. The
= 6B and the normalized depth Z from 0.05 to 2.0. The
minimum ratio of the stress beneath a rectangle to a
range in these parameters reasonably represents the
circle for the conditions analyzed occurs at a normal-
geometry of loads applied by heavy military vehicles.
ized depth of about 0.6, and is about 0.65 for a length/
An example of estimating the length-to-width ratio of
width ratio of 6. As mentioned earlier, the length/width
a wheel load and the values of V and r for a military
ratio of 6 is outside the range of load shapes for wheeled
vehicle follows.
U.S. military vehicles.
WHEEL LOAD GEOMETRY
OF THE M1000 TRAILER
On-highway trucks typically have L:B ratios of 1.4
and off-highway trucks have L:B ratios of 2.0 (Giroud
and Noiray 1981). The M1000 trailer of the Heavy
Equipment Transporter System (HETS) (Fig. 3) likely
has the highest length/width ratio of a wheel load ap-
plied by a U.S. military vehicle. Each axle line of this
trailer has eight wheels (two sets of dual wheels on
each end) (Fig. 4). If we assume that the soil between
the tires aligned on one side of the axle will not fail
(e.g., Giroud and Noiray 1981), then the load carried
Figure 3. M1000 semi-trailer, downloaded from
on that side of the axle can be assumed to be distrib-
USA TACOM (1999).
3


 Previous Page
