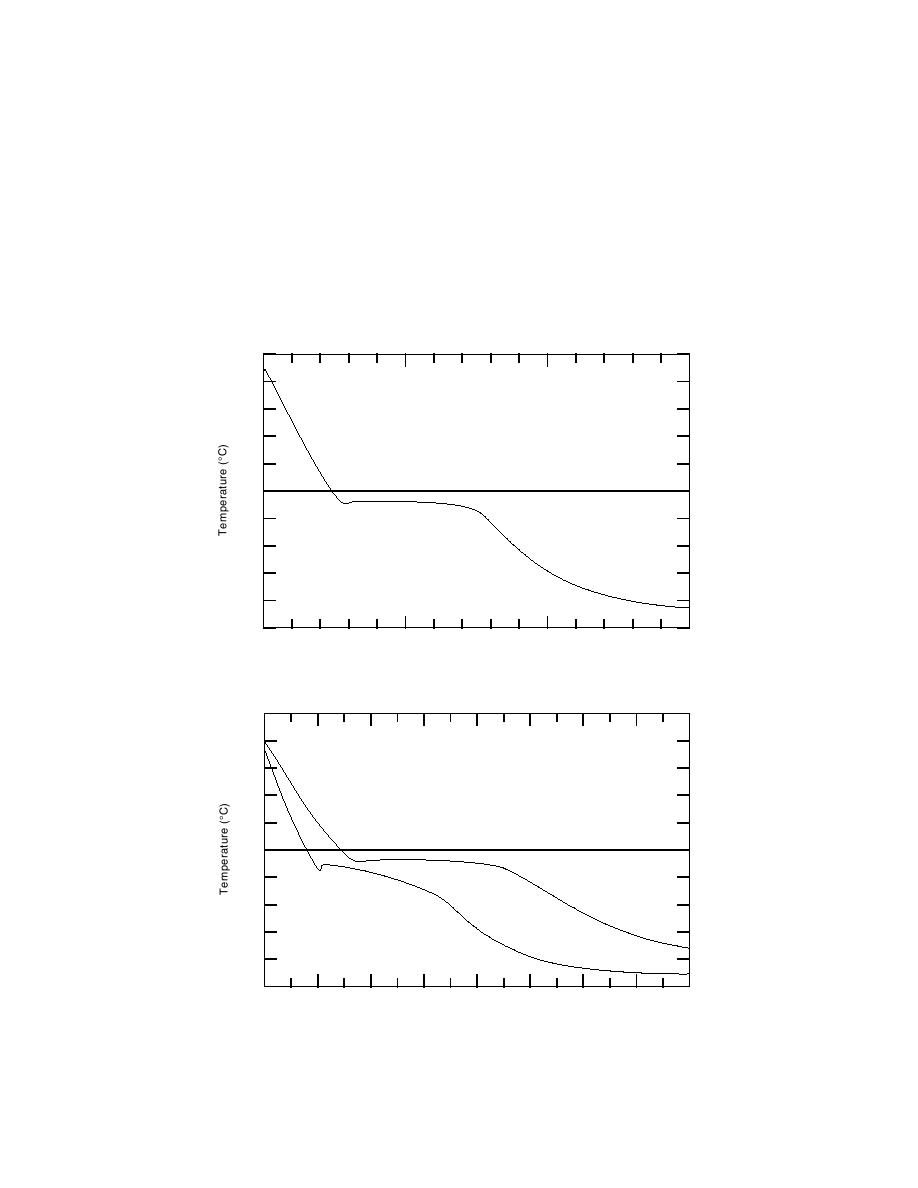
an hour compared to control. Better temperature con-
taining two doses of accelerating admixture on the other.
trol should produce results that are more consistent.
In general, the three curves show that mortar steadily
Despite the apparent problems with the temperature
cools from room temperature to the point where ice
of the room, the useful conclusion from these tests was
suddenly appears. This event is easily identified on all
that the accelerator doses could be much higher than
three curves as the location where the initial slope
those recommended by the manufacturer, especially in
changes. However, a close inspection of each curve
cold weather.
reveals that there are two temperatures to choose from
The freezing points were determined by embedding
at this juncture. For example, the control mortar gradu-
ally cooled from 22C (71.6F) to 2.3C (27.9F)
thermocouples into cylinders of fresh mortar placed into
a 20C (2F) room. Figure 1 shows how the tem-
before suddenly rising to 1.9C (28.6F) and holding
perature changes as thermal energy is extracted from
there for many hours. The lower of the two tempera-
tures represents the instant at which ice spontaneously
control mortar on the one hand, and from mortars con-
25
20
15
10
5
0
5
10
15
20
25
0
150
50
100
Time (min.)
a. Control mortar.
25
20
15
10
5
0
5
Low
10
15
High
20
25
20
40
60
80
100
120
140
0
160
Time (min.)
b. Two mortars made with a low and high dose of ASTM Type C accelerator.
Figure 1. Cooling curves.
4


 Previous Page
