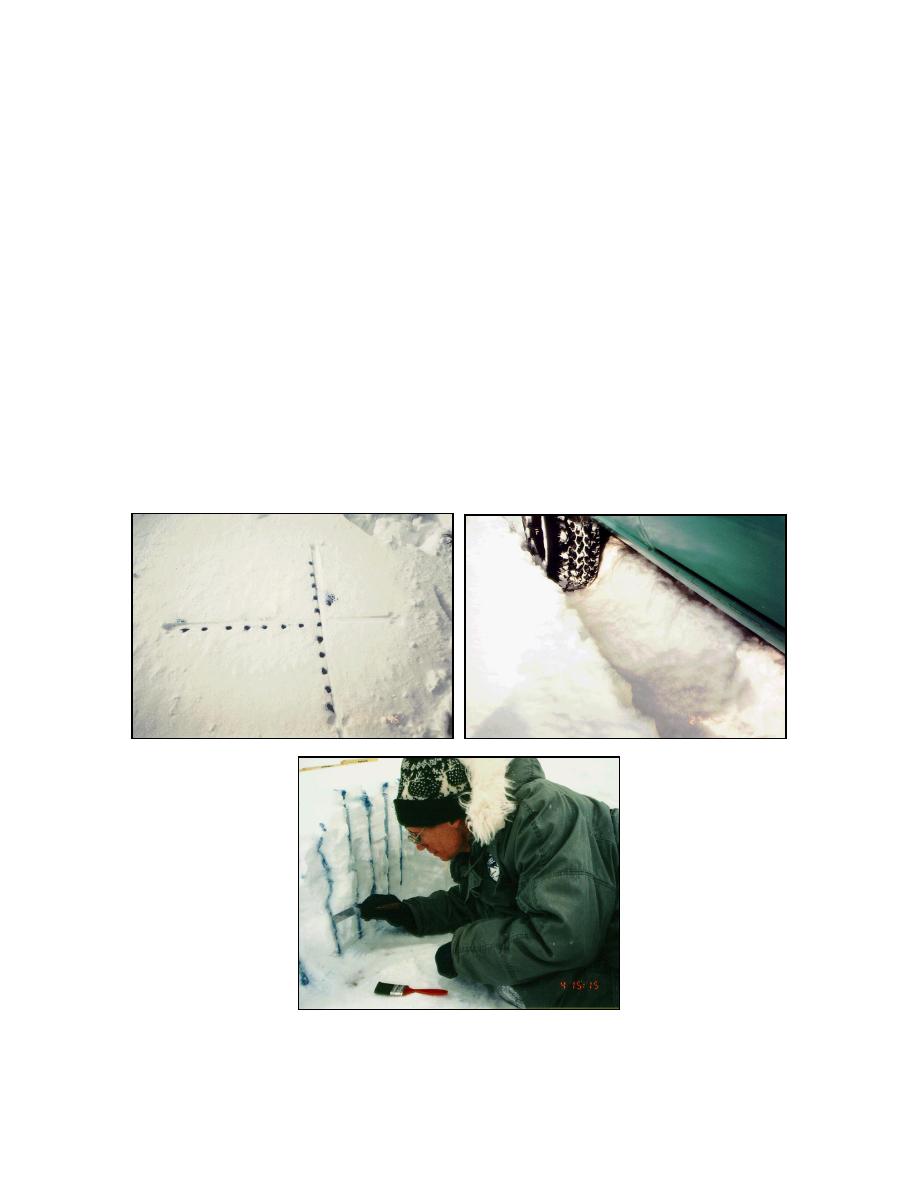
Snow deformation beneath the wheel
snow deformation in cross sections in the direction of
travel (longitudinal) and transverse to the direction of
Snow deformation under a vehicle can be meas-
travel are shown in Figures 65 and 66. The deviatoric
ured by excavating a cross section of the snow as
stress contours shown in the longitudinal cross sec-
shown earlier in Figure 3. Additional detail can be
tion reveal the location where a new shearing surface
obtained by marking the snow prior to deformation
begins to develop ahead of the advancing wheel. The
by backfilling a small-diameter, vertical hole with
failure arc, even for snow, clearly advances down-
dark-colored chalk dust. The vehicle is then driven
ward and away from the wheel, just as shown ex-
into the snow, and the changes in the lines can be
perimentally for sand in Figure 1. The deformation
seen when the cross section is excavated. This proc-
predicted in the model is slightly less than the ob-
ess is illustrated in Figure 64.
served deformation, partly because the model is for
Once the snow cross section has been excavated,
deeper (20 cm) and denser (200 kg/m3) snow than
snow density can be measured by collecting and
weighing samples of a known volume. This was done
occurred in the field. The general shape of the dis-
in several experiments (Richmond 1995). Modeled
placement is the same, however.
deformation of 20-cm, 200-kg/m3 snow was com-
The measured density and the modeled density are
in good agreement, as shown in the transverse cross
pared to measured snow deformation beneath the
section in Figure 67. The modeled density directly
CIV in similar snow conditions. Because the model
beneath the wheel (460 kg/m3) is only 10% different
used ALE meshing, the displacement of the snow
from the measured density (510 kg/m3). Near the tread
was documented by placing tracer particles in the
shoulder, the modeled density was 290380 kg/m3,
model, spaced at the same distance as the markings in
with measured values ranging from 280 to 300 kg/m3.
the field. Comparisons of the measured and modeled
Figure 64. Marking the snow to observe snow de-
formation after vehicle passage.
49


 Previous Page
