(Rong 1996) and empirical (Hewitt 1998b) mod-
touched the water when the soil-gas sample was
els.
added; thus, the formation of bubbles confirmed
Table 6 shows the conversion coefficients (CO)
that a vapor sample was being transferred.
Table 4 shows that the rates of loss for several
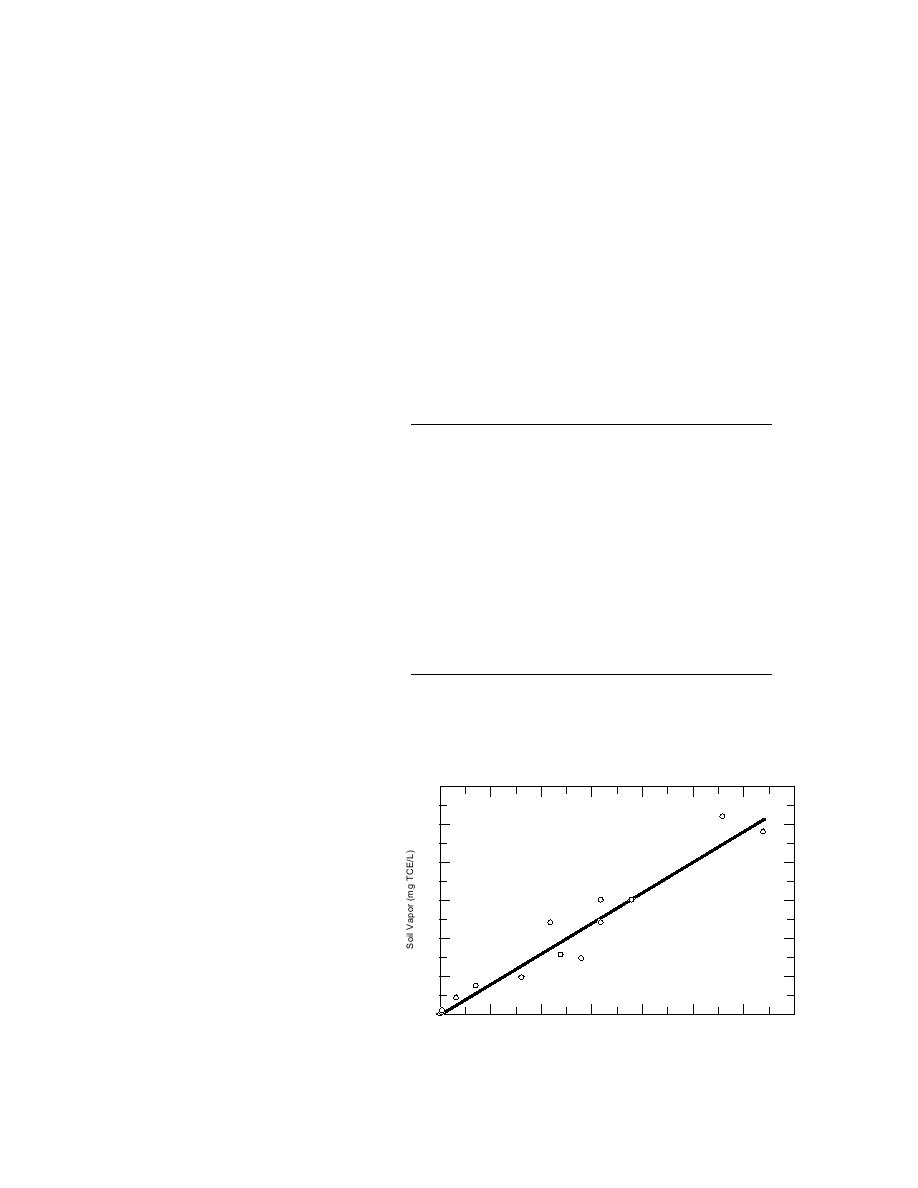
between soil-vapor and soil matrix concentra-
analytes were only about 2% per day of storage.
tions for TCE that have been established in this
Furthermore, the rate of loss was fairly constant,
study and previously. The value for this field
thus a correction factor could be used to restore
study agrees well with the mean value based on
values to day 1 concentrations. Perhaps even
a theoretical model (Rong 1996) and is bracketed
slower rates of vapor loss would have been es-
by those based on a laboratory study (Hewitt
tablished if the sample vials were refrigerated,
1998b). Indeed, the value of 0.806 established for
frozen (12 3C), or treated with an acidified
this study fits between those established in the
solution saturated with sodium chloride. Fur-
laboratory study for soil from the same site,
thermore, the presence of two holes
had no effect because working stan-
Table 5. Soil vapor and collocated soil matrix concentra-
dards prepared with and without
tions.
two holes in the septum frequently
gave the same response.
Sample Soil sample
Triplicate values
Average soil vapor
number (mg TCE/kg)
(mg TCE/L)
(mg TCE/L)*
In general, this storage and hand-
ling system works better than Tedlar
0.019 0.0012 (6.1%)
1
0.021
0.018 0.020 0.018
0.030 0.0
bags (Wang et al. 1996) but not as
2
0.057
0.030 0.030 0.030
(0.0%)
0.043 0.0015 (3.6%)
3
0.051
0.041 0.043 0.044
well as passivated Summa canisters
0.14 0.012 (8.2%)
4
0.18
0.13 0.15 0.15
(Wang and Clifford 1991). However,
0.43 0.031 (7.1%)
5
0.28
0.46 0.40 0.42
neither of these other methods of
2.1 0.20 (9.5%)
†
6
1.7
1.9
2.1
2.3
storing VOC vapors is well suited for
3.7 0.26 (7.2%)
7
3.6
3.4
3.9
3.8
4.8 0.67
soil-gas studies of in-situ concentra-
8
8.1
5.6
4.4
4.5
(14%)
12 1.4
9
11
11
13 NA
(12%)
tions in discrete locations because of
7.8 0.75 (9.6%)
10
12
7.1
8.6
7.8
the volume of sample that is
7.3 0.23 (3.2%)
11
14
7.2
7.6
7.2
required.
12 0.53 (4.8%)
12
16
12
12
13
The data in Table 5 also show that
15 0.0
13
16
15
15
15
(0.0%)
15 1.2
soil-vapor TCE concentrations did
14**
19
14
16
14
(7.7%)
26 1.0
††
15
28
25
27
26
(3.8%)
not appear to become diluted after as
24 2.0
16
32
22
24
26
(8.3%)
many as nine sequential samples
were taken at a single place (location
* Average, standard deviation, and relative standard deviation.
† First equilibriumtemporal study.
14; the subsamples in Table 5 were
** Nine replicate soil-vapor samples collected at this location.
the first, fifth and ninth taken). This
†† Second equilibriumtemporal study.
indicates that a longer probe, with a
NA Sample lost.
larger dead volume, would also be
effective, thus allowing even greater
30
depths to be sampled.
30
The comparison between TCE
25
concentrations in soil-vapor samples
25
and collocated moist soil matrix sam-
20
ples appears in Table 5 and Figure 2.
20
The precision of this sample collec-
15
tion, handling, and analysis method
15
was very good. Frequently (14 out of
10
16 times), a relative standard devia-
y = (0.8055)x
R2==(0..9504)x
0 8055
y
10
tion of less than 10% was obtained for
R2 = 0.9504
5
the triplicate measurements. The lin-
5
ear and highly significant correlation
(r2= 0.950) established between these
0
00
5005
500
10000
0
15000
0
20000
2020
25000
25 0
30000
30 0
35000
3535
1010
1515
0
0
25
30
two methods of characterizing va-
Soi GrabS mpl l gg TC TCE/kg)
SSollilGraabSaampee((m/(mgE/kg)
o Gr b Sample Kg)
dose zone VOC contamination is Figure 2. Correlation between mean soil-vapor TCE concentrations
consistent with both theoretical and soil matrix TCE concentations.
7


 Previous Page
