OVM
DEPTH READING
20'
FEET
PPM
0'
10'
5'
0
0
SCALE:
1.5
0
2.5
0
LOCATION AND SCALE
ARE APPROXIMATE
3
0
OVM
6
0
DEPTH READING
FEET
PPM
OVM
DEPTH READING
0
0
FEET
PPM
4
99
0
0
5
0
1
36
5.5
0
2
600
2.5
113
3
4
OVM
4
0
DEPTH READING
FEET
PPM
1.5
0
2.5
0
3.5
0
4.5
0
OVM
DEPTH READING
FEET
PPM
0
0
1
>1,000
APPROXIMATE
OVM
PLUME LIMITS
INITIAL
DEPTH READING
SPILL
FEET
PPM
LIMIT
GRAVEL
0
>5,000
WORK PAD
1
>5,000
2
>5,000
3
>5,000
4
1,000
5
500
6
200
7.5
120
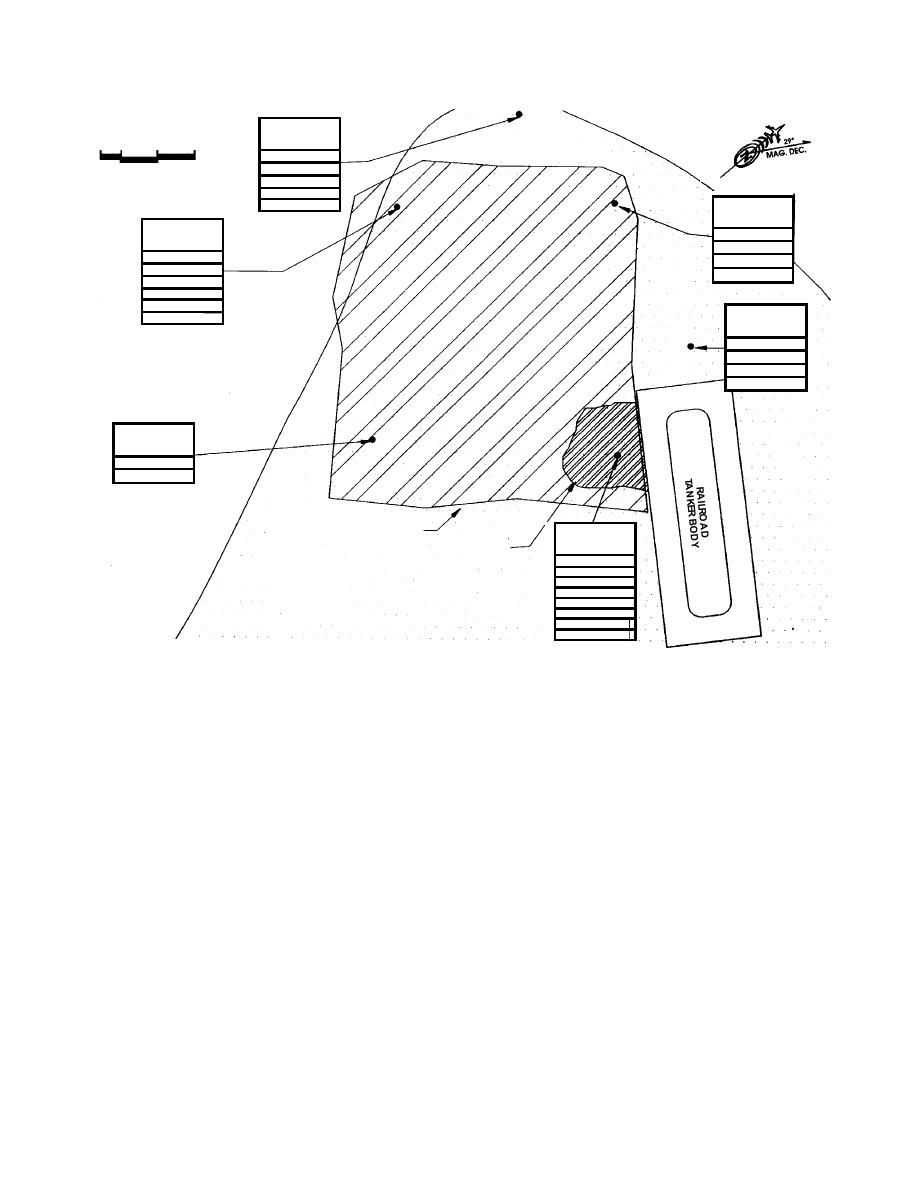
Figure 2. Zone of contaminated soil following tanker spill (OVM is organic vapor meter; 1 ft = 0.3048 m).
burn pit areas and at the site of the truck tanker
Site investigations
body. Benzene detected in the groundwater was
Organic vapors in the soils at various depths
below federal maximum contaminant levels
were analyzed using a hand-held photo-ionization
(MCL), and hydrocarbon contamination was pri-
meter to delineate the plume that resulted from
marily confined to the surface soils.
the railroad tank car release (Fig. 2). The primary
spill covered an area approximately 25 ft (8 m) in
Subsoil and
diameter and 7.5 ft (2 m) deep. Soils at the ground-
groundwater characteristics
water level were contaminated and groundwater
The area that had been used for the fire train-
was affected by the spill. The fuel oil migrated
ing activities was generally underlain by gravel
along the surface of a silt layer located beneath
that was 2 to 3 ft (0.5 to 1 m) thick. Other portions
the 2- to 3-ft-thick (0.5- to 1-m-thick) gravel work
of the area were underlain by silt, sandy silt,
pad covering the area, resulting in a secondary
sand, and silty sand. Soil borings and excava-
plume.
tions at some locations indicated lenses of sandy
During the summer of 1989, a preliminary site
gravel. The water table fluctuates 5 to 7 ft (1.5 to 2
investigation (Shannon & Wilson, Inc. 1989) indi-
m), depending on the stages of the Tanana and
cated that hydrocarbon contamination was
Chena Rivers, and has been measured as high as
present at the old and new burn pit areas, near
2 to 3 ft (0.5 to 1 m) from the surface at some
the truck tanker body, at the burning prop simu-
locations within the site. July 1989 measurements
lator area, near the railroad tanker body, and at
showed a gradient of approximately 0.25 m per
the old drum storage areas (Fig. 1c). The highest
1000 m toward the northwest (Shannon & Wilson,
concentrations were found in the old and new
4


 Previous Page
