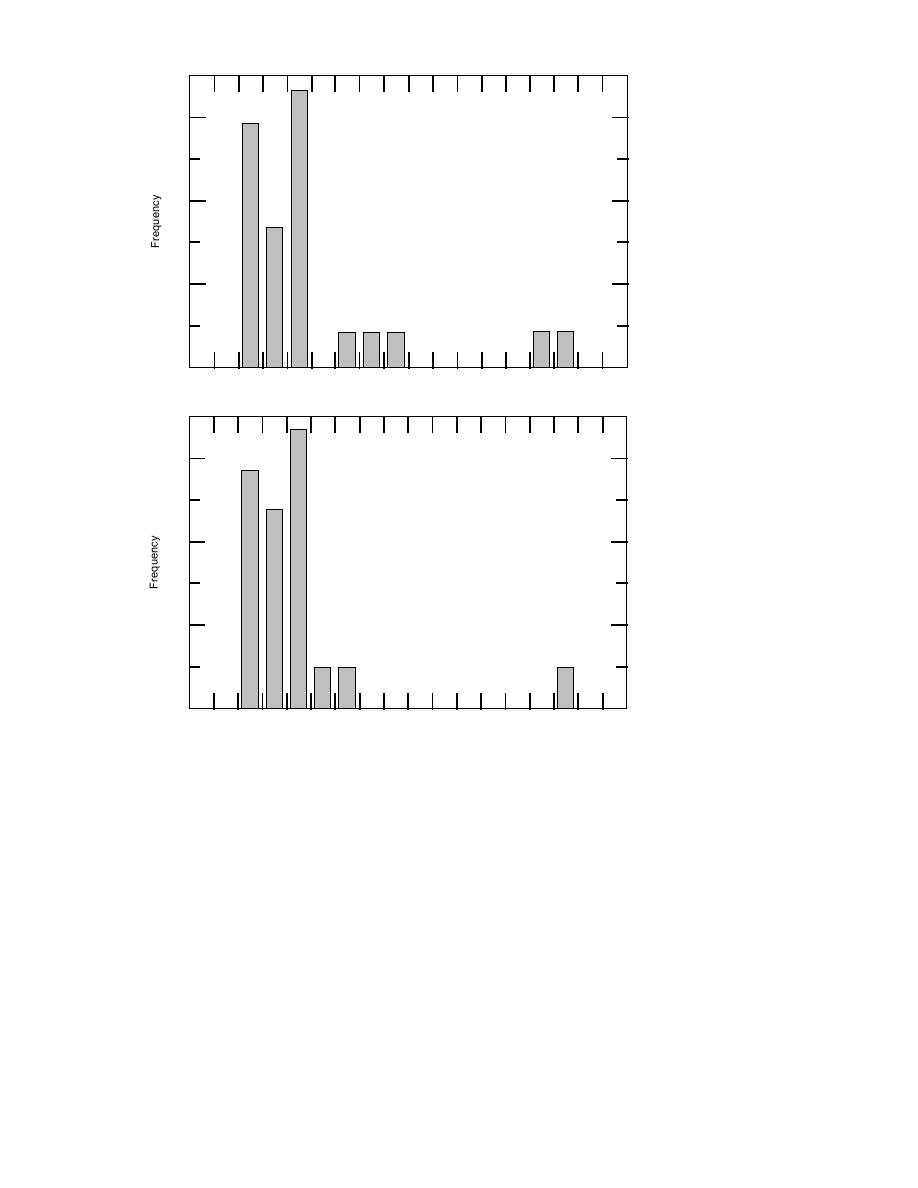
Overlay Design
a
0.3
0.2
0.1
0
0
1000
2000
3000
a. Overlay design.
Spacing between Test Points (ft)
b
Network Level
0.3
0.2
0.1
0
0
1000
2000
3000
b. Network level.
Spacing between Test Points (ft)
Figure 3. Distance between NDT test points.
improving both employee and public safety), and
of FWD test points. Following completion of pave-
3) guaranteeing that adequate data are collected
ment strength variability analysis, we hope to
for overlay design and pavement evaluation.
minimize the cost for overlay design and pave-
Classical statistics can address random vari-
ment evaluation by developing a computer pro-
ability, but neglects relative positions of test points.
gram to optimize the number and location of
However, there currently exist several less tradi-
FWD test points. Ideally, it would continually
tional mathematical models that can quantify spa-
adjust the optimal distance to the next test point
tial variability of pavement properties.
in real time as data are collected in the field. Based
The following is a simplified look at a geo-
upon preliminary work, this continually adjust-
ing optimal test point configuration computer pro-
statistical model that provides the basis for the
proposed test point spacing optimization program.
gram would maximize efficiency of FWD testing
Test points located close together (e.g., the 10-ft
by 1) eliminating both undertesting and over-
grid in Fig. 4a) yield similar test values. The vari-
testing (thereby eliminating underdesign and over-
ance (or statistical measure of spread) of differ-
design), 2) minimizing lane closure time (thereby
4


 Previous Page
