Overlay Design
a
0.6
0.4
0.2
0
4 103
0
1
2
3
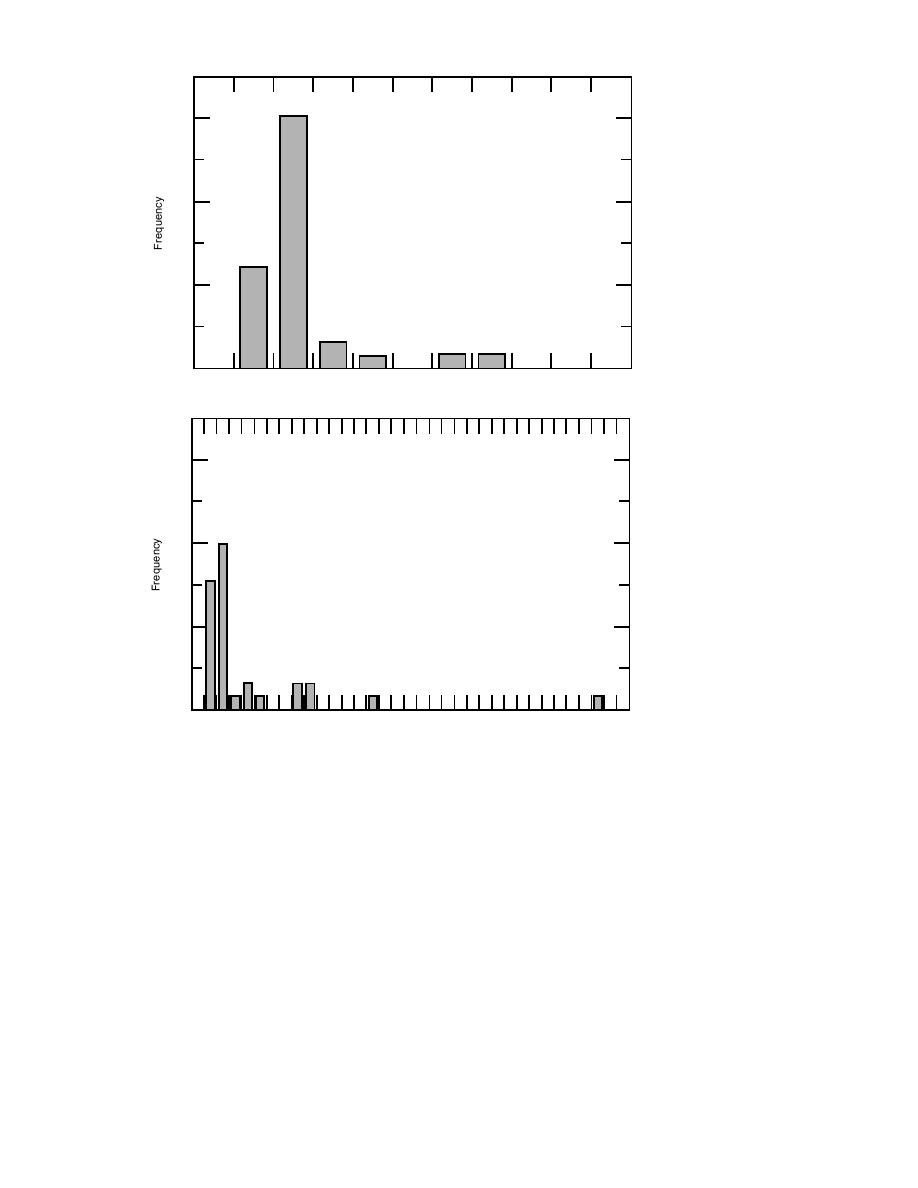
a. Overlay design.
Miles Tested Per State
Network Level
b
0.6
0.4
0.2
0
16 103
0
2
4
6
8
10
12
14
b. Network level.
Miles Tested Per State
Figure 2. Miles tested per state.
2b's outlier of approximately 15,000 miles per year
poses approach 3000 ft. Spacing could not always
corresponds to a state with an entire fleet of FWDs.
be quantified as a particular distance because sev-
eral states indicated a minimum number of test
Spacing and configuration
points per project.
of NDT test points
Survey results indicated somewhat of a corre-
lation between test pattern and "new and old"
PLANS FOR OPTIMIZING
FWD owners. Generally, new owners test in mul-
TEST POINT SPACING
tiple locations (e.g., centerlines and wheelpaths)
whereas veteran owners, for the most part, tend
Pavement design and evaluation models and
to test in just the right wheelpath. Spacing for
testing equipment continue to grow increasingly
purposes of network/inventory and overlay de-
sophisticated, but only a limited amount of atten-
sign tends to range from 100 to 1000 ft (Fig. 3a
tion has been directed toward answering ques-
and 3b). Outlier reports of spacing for both pur-
tions regarding the optimal number and location
3


 Previous Page
