creases dramatically (Atkins 1989). This marked
change in resistance is a more reliable indication
of the phase of soil water than soil temperature
alone, because a soil can be 0C when the water
within its voids is still unfrozen (Atkins 1979).
When most of the soil water between a ring
pair is frozen, the resistance recorded by that pair
tends to level off until the soil begins to thaw,
then the resistance drops just as rapidly as when
it froze (Fig. 14). When thaw is complete, the
resistance returns to a before-frost value. Thus, I
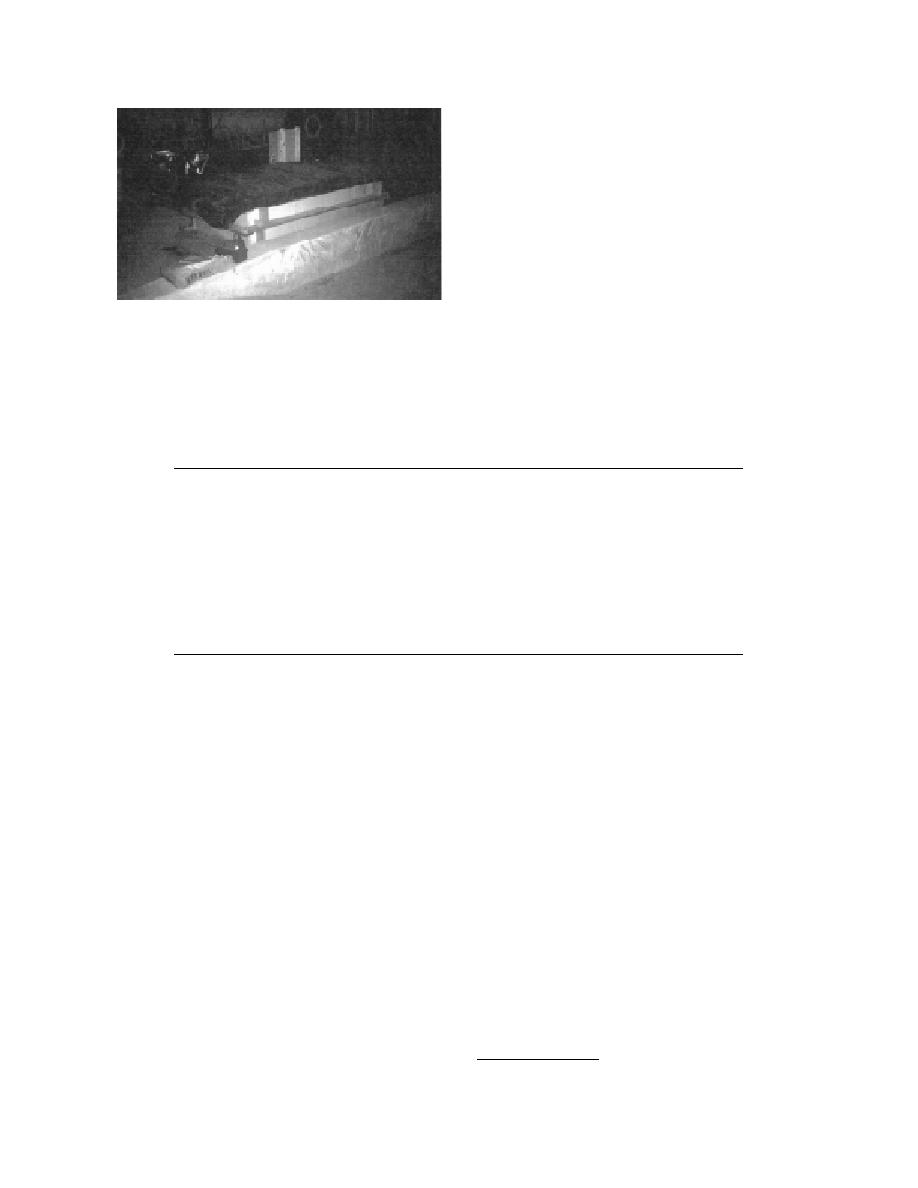
Figure 11. Soil bin, during a freeze, covered with pan-
determined the frost penetration rate in the bin
els and an insulating blanket.
from the resistance curves that showed the time
when freezing began and when the frostline
reached the depths of the successive ring pairs,
which were at known depths.
Table 3. Measurements and instrumentation.
Measurement
Measurement
Condition
Measurement
Instruments
accuracies
0C isotherm
Temperature (C)
0.1C*
RG Thermocouples
Hourly
Frost depth
Soil resistance
Resistivity gages
Absolute units
Hourly
(millivolts)
not measured;
change is
important
Soil surface
Distance from datum
Millimeter stick
+1 mm (est.)
Before and after
to soil surface (mm)
freeze and
during thaw
0.015 to
Hydra Probes†
Soil water
Temperature-corrected
Hourly
dielectric constant;
0.020**
0.003††
converted to % by volume
Within temperature range of the experiment, 12 to 20C.
*
†
Vitel, Inc. (1994).
**
Absolute accuracy with no soil-specific calibration performed.
††
Relative accuracy in the same soil.
about 5 in. (13 cm) above the soil surface and
Four thermocouples measured the tempera-
cooled the air between them and the soil. The
tures of the bottom of the panels (Tp), the air (Ta)
freeze (F) portion of a FT cycle is the period when
between the panels and the soil surface, the soil
the bin air temperature (Ta) was 0C or below.
surface next to RG C (Tssc), and the soil surface in
Thaw (T) began when the panels were removed
the middle of the rill (Tssr) (Fig. 13). These ther-
and the bin soil was exposed to the ambient air;
mocouples and those in the RGs were from the
thaw ended when soil resistances showed that all
same manufactured wire lot, and four from that
frozen soil had melted.
lot were calibrated in an ice bath to determine
Frost depth was measured by two Resistivity
their absolute accuracy. Three sets of measure-
Gages (RG) (Table 3) constructed and installed
ments were taken at 5-minute intervals while the
according to Atkins' specifications (1979, 1990).
bath was stirred. The 12 readings averaged
0.035C, with a standard deviation of 0.032C,
Each gage consists of a PVC rod with 18 copper
rings (Fig. 12) to measure soil resistance and 10
and maximum and minimum readings were
0.027C and 0.080C respectively. Thus, all the
thermocouples to measure soil temperature. The
RGs were mounted to the bottom of the bin (Fig.
thermocouple temperatures have an absolute ac-
curacy of 0.1C and a relative accuracy of
12b); the final soil surface was even with the RG
0.01C.*
tops (Fig. 13). The RG measures soil resistance
and, as the water in the soil between two rings on
the rod freezes, the resistance of that soil in-
* Personal communication with K. Knuth, CRREL, 1995.
11


 Previous Page
