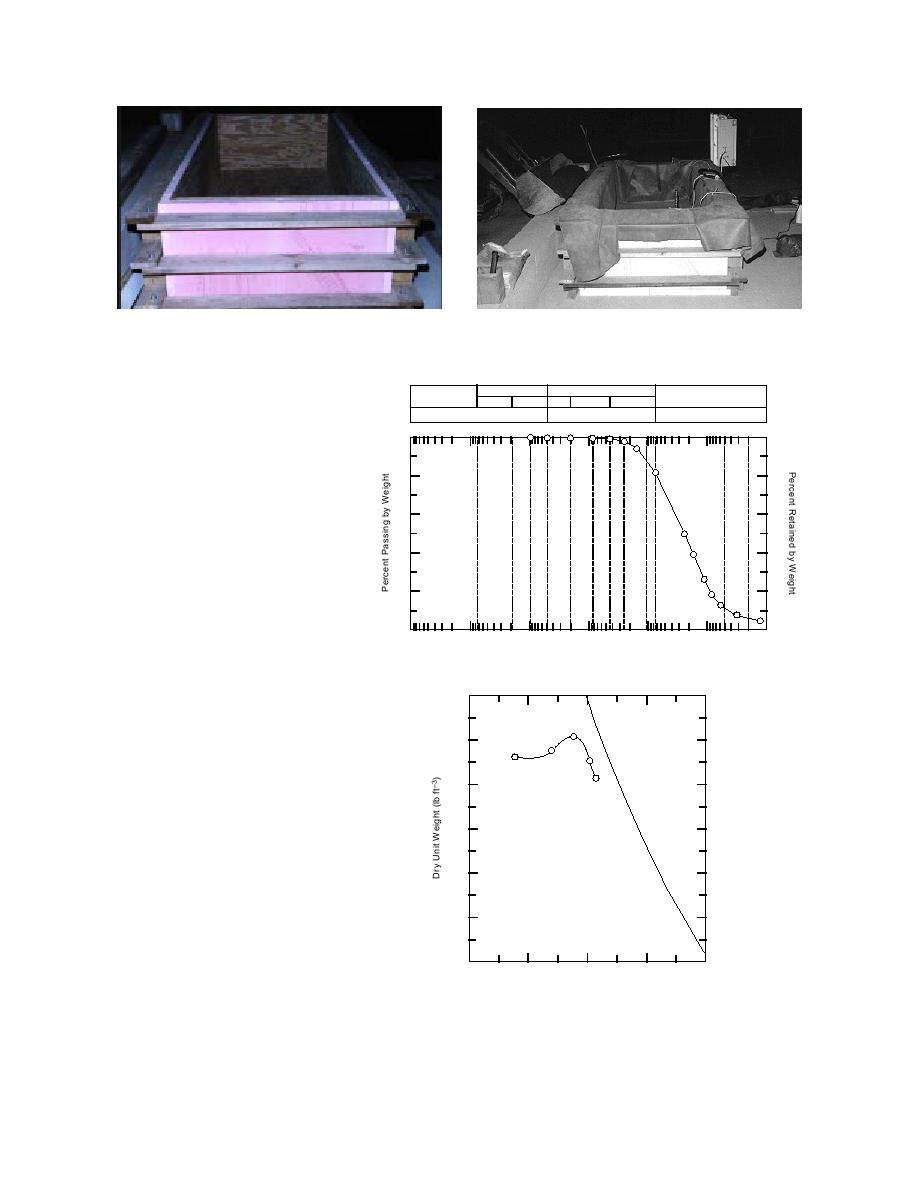
a. General construction.
b. Bin liner (south side in foreground).
Figure 8. Experimental soil bin.
closed system, so the only water in
the soil during the tests is that
GRAVEL
SAND
COBBLES
SILT or CLAY
Crs
Fine
Crs Medium Fine
present at the start.
U.S. Sieve Size (in)
U.S. Standard Sieve #
Hydrometer
3
3/4 3/8 4
10
20 40 60 140 200
100
0
Soil
The soil is a low-plasticity, inor-
80
20
ganic clayey-silt, with 81.6% silt-
and clay-sized particles and 17.7%
60
40
fine sands (Fig. 9a) and is classified
as ML in the Unified Soil Classifica-
tion System. It has a specific gravity
40
60
of 2.72, a liquid limit of 28%, and a
plastic index of 1 (Shoop and Gatto
20
80
1992). The Proctor test shows that its
maximum dry density is achieved at
0
100
1000
100
10
1
0.1
0.01
0.001
17% gravimetric soil water content
Grain Size (mm)
(Fig. 9b). The silt was wetted to a
a. Grain size distribution (ASTM 1996a).
gravimetric water content of 21 to
23% (Table 2), which is 92 to 97% sat-
110
urated to simulate a thawed, satu-
rated silt at a cold, humid site in ear-
105
ly spring, and placed into the bin.
We placed two to three backhoe
buckets of soil in the bin, spreading
100
each bucket load with a shovel and
raking it level. When this loose soil
95
was about 8 in. (20 cm) thick, we
tamped it to a 6-in. (15-cm) soil layer
90
and roughened the surface with a
rake before the next backhoe load
was placed to reduce the develop-
85
ment of boundaries between the lay-
ers. Three soil layers were prepared
80
in this fashion. Dry densities and
0
10
20
30
40
Moisture Content (%)
volumetric water contents of the soil
at the surface of each layer were 103
b. Proctor test results with 5.5-lb (2.5-kg) ham-
104 lb/ft3 (1.641.67 Mg/m3) and
mer (ASTM 1996b).
3538%, respectively (Table 2).
Figure 9. Silt used in tests.
On the surface of the final soil
layer, we formed a rectangular rill
9


 Previous Page
