es in response, simple five-minute static extraction
factor of 1:100 with reagent-grade water, and head-
should provide satisfactory precision and sensitiv-
space SPME was repeated, followed by isooctane
ity if timing and extraction conditions are consis-
extraction of the same aliquot of sample.
tent. When analyzing samples in a field lab, elimi-
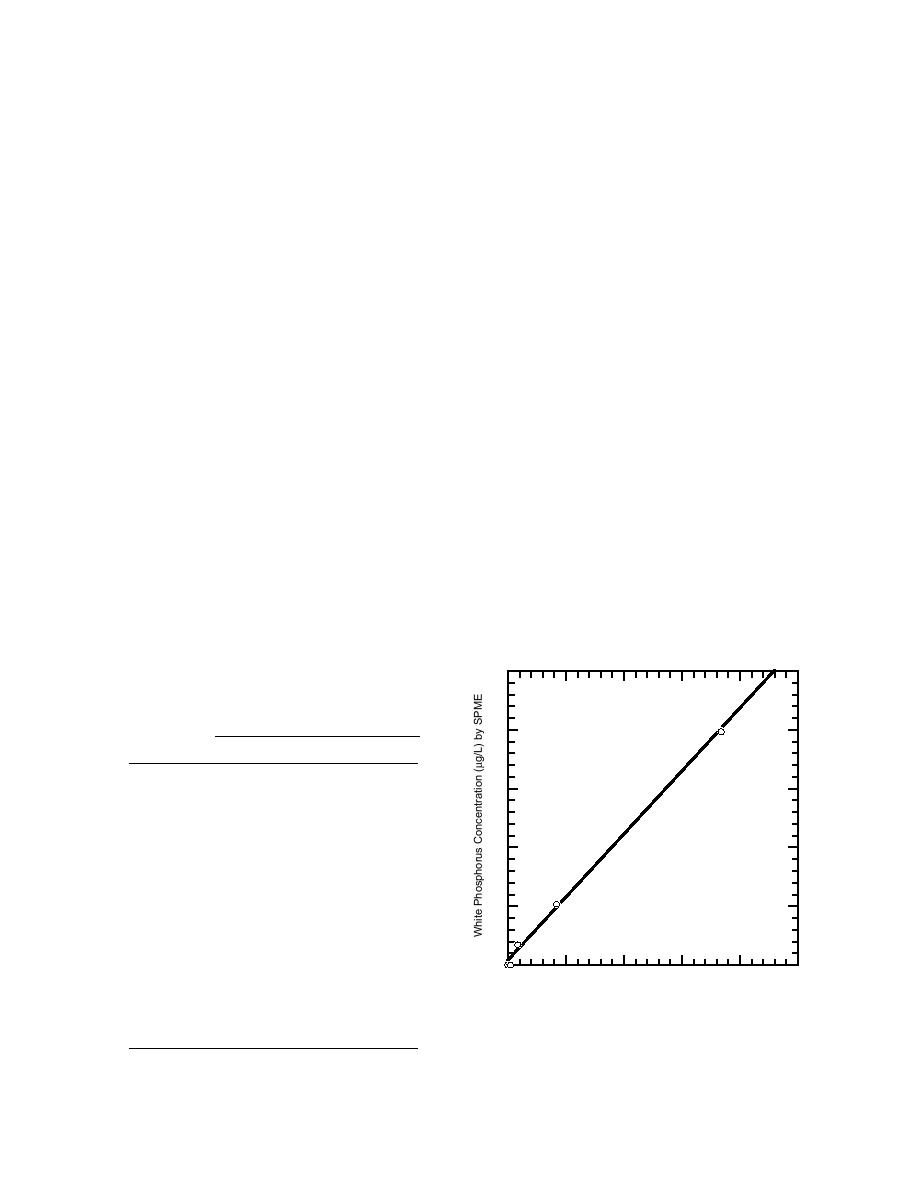
Agreement between the methods was good, as
was the precision of the headspace SPME method
nating the need for extra equipment and steps in
(Table 9). Regression of the mean of the headspace
the method will save time and money.
SPME determinations with those by solvent extrac-
tion yielded a linear model with slope of 1.07 and
Field samples
R2 of 0.997 (Fig. 4). Although the data set is small
and more samples need to be analyzed for confir-
Water
mation, these initial results showed good agree-
Water samples were collected from a salt marsh
ment between the different methods.
that was contaminated by white phosphorus mu-
nitions (Racine et al. 1993). Each of the five sam-
Sediment
ples plus a blank were analyzed first by headspace
SPME and concentrations estimates obtained us-
A much larger number of sediment samples
ing aqueous calibration standards. Triplicate mea-
were available for analysis. A total of 92 sediment
surements were made on some samples to estimate
samples was analyzed by headspace SPME fol-
precision with real samples. White phosphorus was
lowed by solvent extraction. We used the same
detectable by headspace SPME in three of the five
subsample for both types of extractions. Of these
water samples (Table 9).
samples, 30 were blank and 62 were positive by
Solvent extractions were then performed, either
both methods; therefore, there were no false posi-
with isooctane or diethyl ether, depending on the
tives or false negatives for the headspace SPME
concentration. One sample had an estimated con-
method. The sediment samples varied widely in
centration of 0.1 g/L, which is barely detectable
salt and organic matter content, and this matrix
by isooctane extraction, so both types of extractions
heterogeneity resulted in a poor correlation be-
were performed, with the isooctane extraction per-
tween the amount of white phosphorus detected
formed on the same subsample as the headspace
by headspace SPME and the concentration found
SPME. One sample was overrange using the head-
by solvent extraction (Fig. 5a, b). Nonetheless,
space SPME method. The sample was diluted by a
headspace SPME proved to be an excellent screen-
Table 9. Estimates of white phosphorus concen-
0.5
trations by headspace SPME and solvent extrac-
tion in field-contaminated water samples.
Estimated concentration (g/L)
0.4
Headspace Solvent extraction
Sample
SPME
isooctane*
Ether
<d
1
0.003
0.3
<d
<d
<d
<d
2
<d
<d
0.2
<d
3
0.0348
0.0149
0.0354
0.0187
0.1
0.0355
4
0.109
0.0834
0.0759
0.106
0.0972
0
0.1
0.2
0.3
0.4
0.5
>17.2 (overrange)
5
39.7
White Phosphorus Concentration (g/L) by Solvent Extraction
38.7
5 (1/100 dilution)
0.399
0.369
Figure 4. Concentration (g/L) of white phosphorus
<d
<d
Blank
estimated by headspace SPME vs. solvent extraction
* Isooctane extraction of the same subsample as headspace
for field-contaminated water samples.
SPME.
9


 Previous Page
