r = 189.5
mm
1143
mm
254
mm
4
3
2
1
86.8
mm
2
1
101.6
4
3
mm
218.9
r = 1814
mm
228.6
mm
mm
330.2
330.2
431.8
431.8
mm
mm
13
mm
mm
b. MD: DC 9
a. Boeing 757
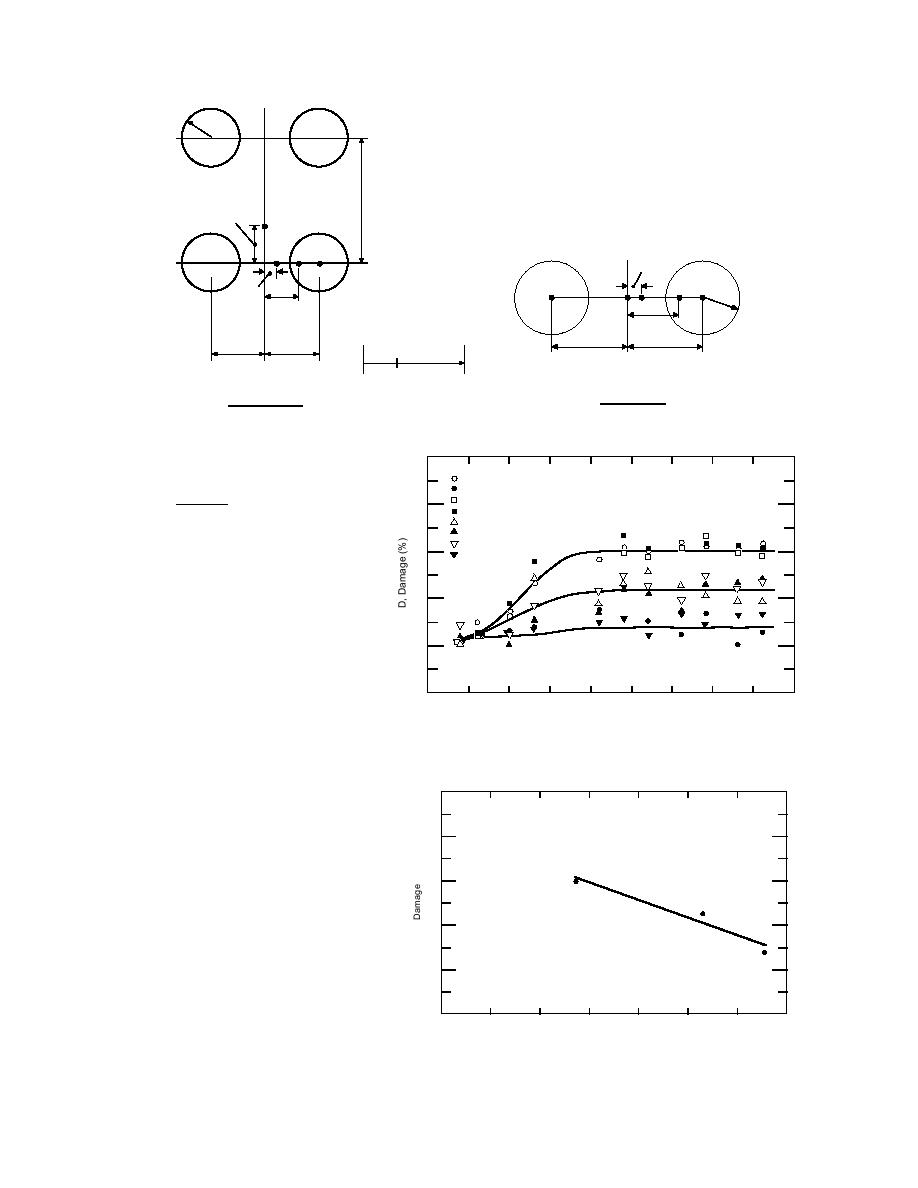
Figure 28. Configuration and location of stress calculations for Boeing 757 and MD-DC9.
100
strength of the PCC layer
Central Wisconsin Airport
LOC 2
Boeing 757
σ tensile
LOC 3
D=
LOC 6
.
80
σ flexural
LOC 9
LOC 16
LOC 17
LOC 19
254 mm
60
Layer moduli from ILLIBACK were used
LOC 24
to represent the pavement structures. The
computer program BISAR was used to calcu-
305
40
late the stresses at locations shown in Figure
28. The stress calculation points are the same
330
as those used in FAALEA. The results are
20
tabulated in Table 10 and damage is shown
for CWA in Figure 29. As thaw progresses,
0
the amount of damage increases until thaw-
14 Mar
19
24
29
3 Apr
8
13
18
23
28
ing is complete; then it levels off with time.
Figure 29. Amount of damage during spring thaw at Central Wis-
The results also indicate that the damage is a
consin Airport.
function of pavement thickness, a linear rela-
tionship being found in the 24 April data
from CWA (Fig. 30).
1.0
The thinner pavements (178 to 203 mm)
D = 0.004t + 1.6356
at OCA showed potential near-failure condi-
R 2 = 0.95
0.8
tions during the spring thaw (Fig. 31). Some
pavements recovered somewhat, as typified
by location 9 (Fig. 31). The thicker section
0.6
(location 23, 254 mm) had a similar amount
of damage as those sections of similar thick-
0.4
ness at CWA; however, the OCA sections did
not exhibit the loss during the thawing peri-
od observed at CWA.
0.2
The horizontal stresses are plotted as
functions of the subgrade modulus, coeffi-
0
cient of subgrade reaction and the PCC mod-
200
220
240
260
280
300
320
340
PCC Thickness (mm)
ulus in Figures 3234. With respect to the
Figure 30. Effect of pavement thickness on damage at Central
PCC modulus, no trends were seen (Fig. 34),
Wisconsin Airport.
and nonlinear trends were observed for all of
25


 Previous Page
