Outagamie County Airport
gressed were also made at CWA (Fig. 10a,b). At some
At the beginning of spring thaw, the basin areas are
locations, we observed that the basin areas are a func-
low, indicating a stiff pavement structure. As expect-
tion of the pavement surface temperature during the
ed, we observed that as the pavement structure
recovery period (Fig. 10c). As the temperature
thawed, the basin areas increased. As mentioned
changed, so did the basin area.
above, we have used plots of the deflection basin area
A study was made to see if there was any relation-
versus time to identify periods of thaw weakening and
ship between surface temperature and ISM or basin
recovery.
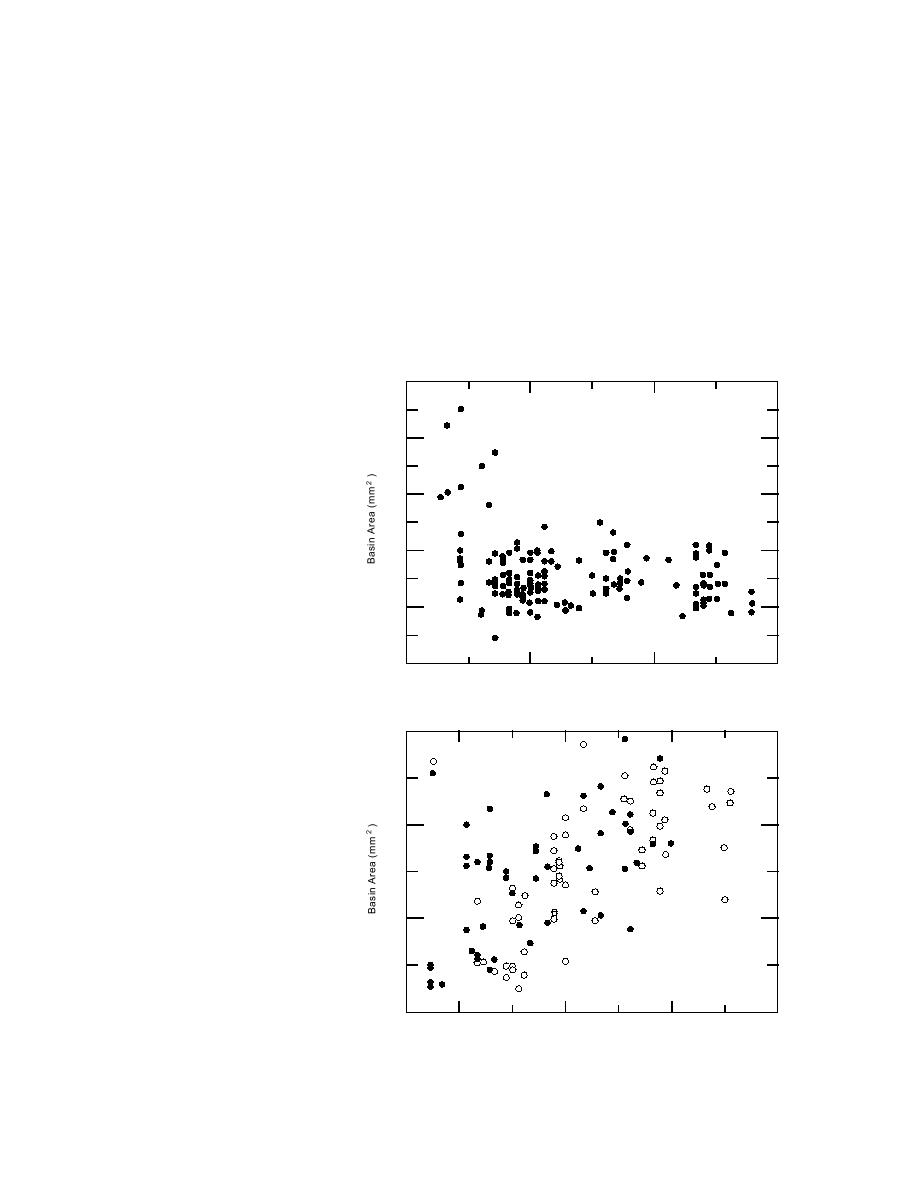
area. Figures 12a and 13a show that there is no rela-
At FWD locations 3 and 7 (Fig. 9a), the basin areas
tionship between either basin area or ISM with sur-
face temperature at OCA. The data around 5C indi-
increase somewhat at the beginning of thaw and then
level off after 5 April. This suggests that the pavement
cate some form of relationship. However, we felt that
structure at these locations does not undergo substan-
the decrease in basin area or increase in ISM was
tial thaw weakening. However, at other locations,
probably attributable to the presence of frozen subsur-
such as FWD sites 22, 23 and 24, the pavement struc-
face layers.
ture undergoes more substantial
1000
thaw weakening and recovery, as
shown by the shape of the basin
Outagamie County Airport
area curves in Figure 9a. If total
800
recovery is assumed to occur on 23
April, the bearing capacity of the
pavement structure at locations 22,
23 and 24 was reduced by 30 to
600
40%.
The changes in the ISM can
also be used to identify periods of
400
thaw weakening and recovery. The
changes in ISM with time for the
same FWD locations discussed
200
previously are shown in Figure 9b.
At the beginning of spring thaw,
the value of the ISM is large, indi-
0
10
20
30
cating a stiff structure. During
Surface Temperature (C)
thaw, the ISM drops and at loca-
a. Outagamie County Airport.
tions 3 and 7 it levels off, indicat-
ing no substantial spring thaw
600
weakening (Fig. 9b). As indicated
Runway 17-35
above, no FWD data were obtained
Runway 8-26
during the most critical period
from 29 March through 5 April. A
similar trend was seen in the basin
400
area (Fig. 9a). At the other loca-
tions in Figure 9b, some thaw
weakening was observed. If the
pavement structure is considered
to have fully recovered on 23
200
April, the amount of thaw weaken-
ing shown by the ISM is approxi-
mately 17 to 25%. This is lower
than that predicted by the basin
Central Wisconsin Airport
area method.
0
10
20
30
0
Surface Temperature (C)
Central Wisconsin Airport
b. Central Wisconsin Airport.
The same observations of the
Figure 12. Relationship between surface temperature and basin area.
increase in basin area as thaw pro-
13


 Previous Page
