at the center of the slab, at transverse joints, longitudi-
CWA were obtained from the nearest weather station,
nal joints and at a corner. The FWD test program con-
which was located approximately 24 km north of the
sisted of one drop at each of four height levels produc-
airport at Wausau, since there was no meteorological
ing loads of 600, 900, 1100 and 1600 kN, respectively,
station at CWA. These air temperatures were used to
on the pavement surface. The deflection sensors were
determine air-freezing indices (Fig. 6). The air-freez-
located at 0, 300, 600, 900, 1200, 1500 and 1800 mm
ing index was calculated in Celsius degree-days using
from the center of the loading plate. The FWD loading
plate used was 300 mm in diameter. The location of the
Tmax + Tmin
181
∑
Air-freezing index =
FWD tests at the two airports are shown in Figure 4.
2
n=1
daily maximum temperature (C)
where Tmax =
ENVIRONMENTAL DATA ANALYSIS
daily minimum temperature(C)
Tmin =
(n = 1) =
1 October 1985
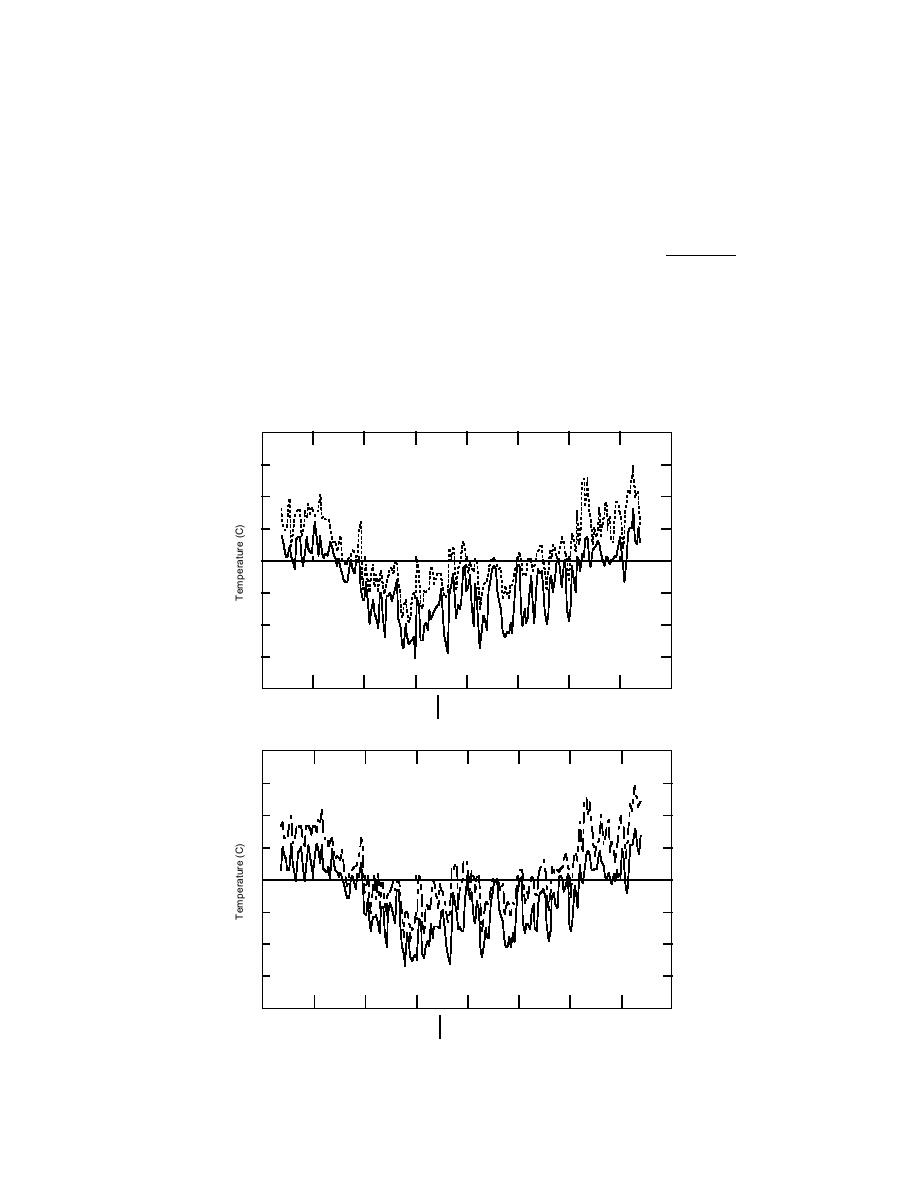
The environmental data used in this analysis were
n=
181 = 30 April 1986.
the air temperature and subsurface temperatures. The
daily maximum and minimum air temperature at the
The air-freezing index range was 1100 and 920C
airports between 1 October 1985 and 30 April 1986 are
days at CWA and OCA respectively. The design freez-
presented in Figure 5. The air temperature data used at
40
Wausau, Marathon County
20
Maximum
0
Minimum
20
40
20 Sep
20 Oct
19 Nov
19 Dec
18 Jan
17 Feb
19 Mar
18 Apr
18 May
1985
1986
a. Central Wisconsin Airport.
40
Outagamie County Airport, Appleton
20
Maximum
0
Minimum
20
40
20 Sep
20 Oct
19 Nov
19 Dec
18 Jan
17 Feb
19 Mar
18 Apr
18 May
1985
1986
b. Outagamie County Airport, Appleton.
Figure 5. Daily maximum and minimum temperatures.
5


 Previous Page
