0.5
the benzene concentration was increased by 0.28
g/mL (Fig. 1i). The benzene travel time through
Dissolved (g /mL)
Adsorbed (g /g)
the vadose zone was also increased (+1 years).
3
Air-in-pores (g /cm )
0.4
MANUAL CHECKS OF OUTPUT FILE
0.3
For confirmation, the output results were man-
ually checked for water balance, benzene mass in-
put, benzene mass distribution for each layer, ben-
0.2
zene concentration in the soil water at the lowest
soil sublayer, and maximum benzene depth. SE-
SOIL simulated these parameters precisely as per
set equation codes.
0.1
Water balance
The water balance was checked by using the
0
20
40
60
80
100
equations
Time (yrs)
i. Lower biodegradation rate in liquid phase input
P E MR = S + G = Y
(1)
parameter (2.74 104 compared to 5.48 104).
and
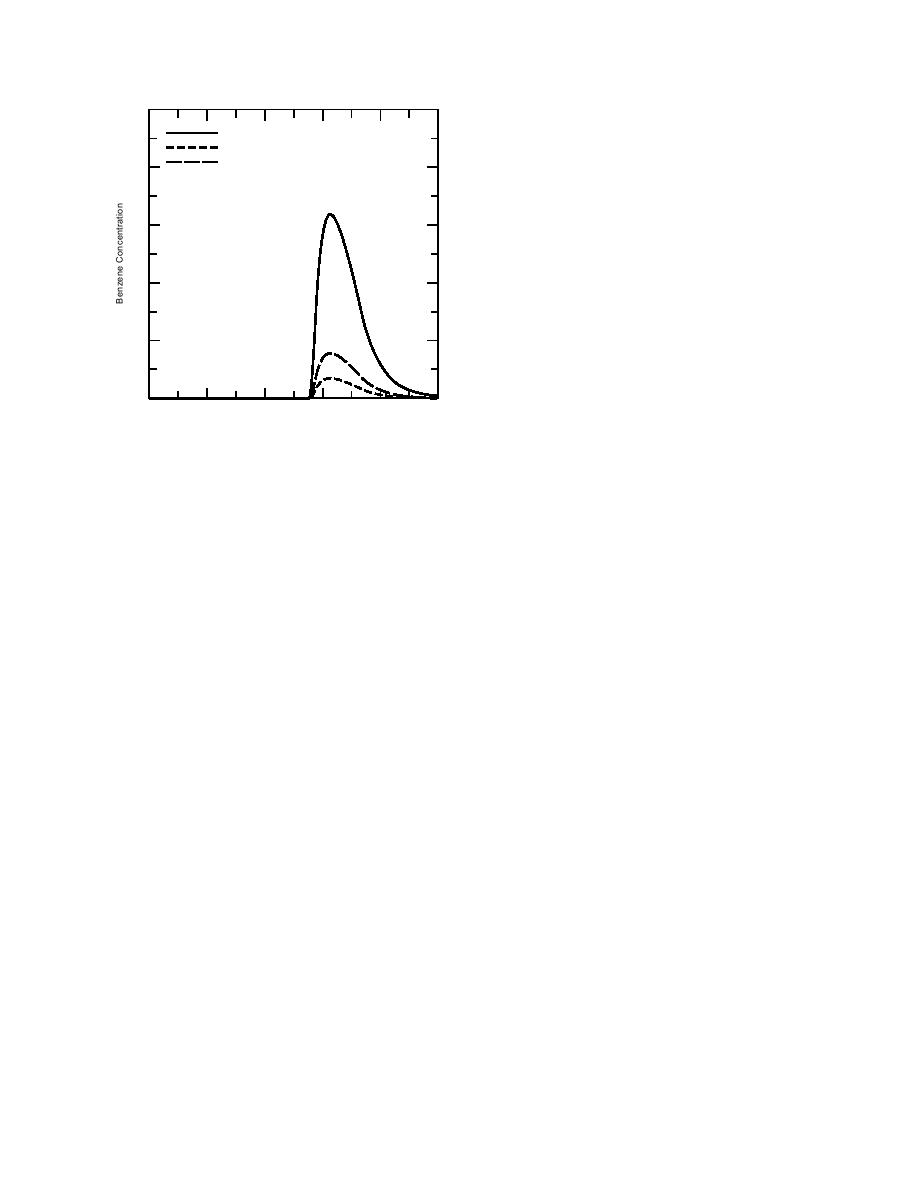
Figure 1 (cont'd). SESOIL model simulations for ben-
I=PS
(2)
zene concentration vs. time at 5330-cm depth.
where P = precipitation
E = evapotranspiration
Drewett et al. (1993) estimates. This may be attrib-
MR = moisture retention
utable to the higher volatilization of the benzene
S = surface runoff
compound because of increased porosity, which
G = groundwater runoff or recharge
allowed more air-filled voids.
Y = yield
I = infiltration.
Soil organic carbon content (Foc, %) and koc
SESOIL showed high sensitivity to organic car-
SESOIL provides solutions to eq 1 and 2 by iter-
bon content. Organic carbon had a significant effect
ating on soil moisture until the calculated value
on the rate of chemical movement, as well as on the
for precipitation is within 1% of the user provided
peak leached concentration. Slight reduction in or-
input value. After the completion of this iteration,
ganic carbon (0.13 to 0.09%) elevated the benzene
the individual components such as infiltration,
concentration (0.56 g/mL, Fig. 1f), and the con-
evapotranspiration, moisture retention, surface
taminant was released to groundwater 10 years
runoff and the groundwater runoff (recharge) are
earlier than the original estimates calculated.
known. Infiltration is checked as the difference be-
The koc, adsorption coefficient on organic car-
tween the precipitation and the surface runoff,
bon, had a slight effect on the sensitivity of
which is equal to the moisture retention plus the
SESOIL. By lowering the koc value from 83 to 69
evapotranspiration plus the groundwater runoff.
(Fig. 1g), the peak concentration of benzene ele-
vated (0.13 g/mL) compared to the Drewett et al.
Benzene mass input
Benzene mass (g) includes the amount of ben-
(1993) tests. Similarly, koc also lowered benzene
transport time (5 years) to the groundwater com-
zene in the precipitation and the amount loaded
pared with the original simulations.
into each of up to four major layers. SESOIL com-
putes the amount of benzene in the precipitation
as
Biodegradation rate in solid and liquid phases
As expected, reducing the biodegradation rate
[benzene concentration in rain/benzene
of the solid phase (5.48 104 to 2.74 104)
maximum solubility in water] solubility in
increased both the benzene concentration (+1.29
water infiltration rate area of application.
g/mL) and the travel time to groundwater (+2
years, Fig. 1h). When the biodegradation rates
The benzene load in each layer is calculated from
the area of application benzene application. To
of the liquid phase were reduced to 2.74 104,
8


 Previous Page
