0.004
Dissolved (g/mL)
Dissolved (g/mL)
0.8
Adsorbed (g/g)
Adsorbed (g/g)
Air-in-pores (g/cm3)
3
Air-in-pores (g/cm )
0.003
0.6
0.002
0.4
0.001
0.2
0
20
40
60
80
100
0
20
40
60
80
100
Time (yrs)
Time (yrs)
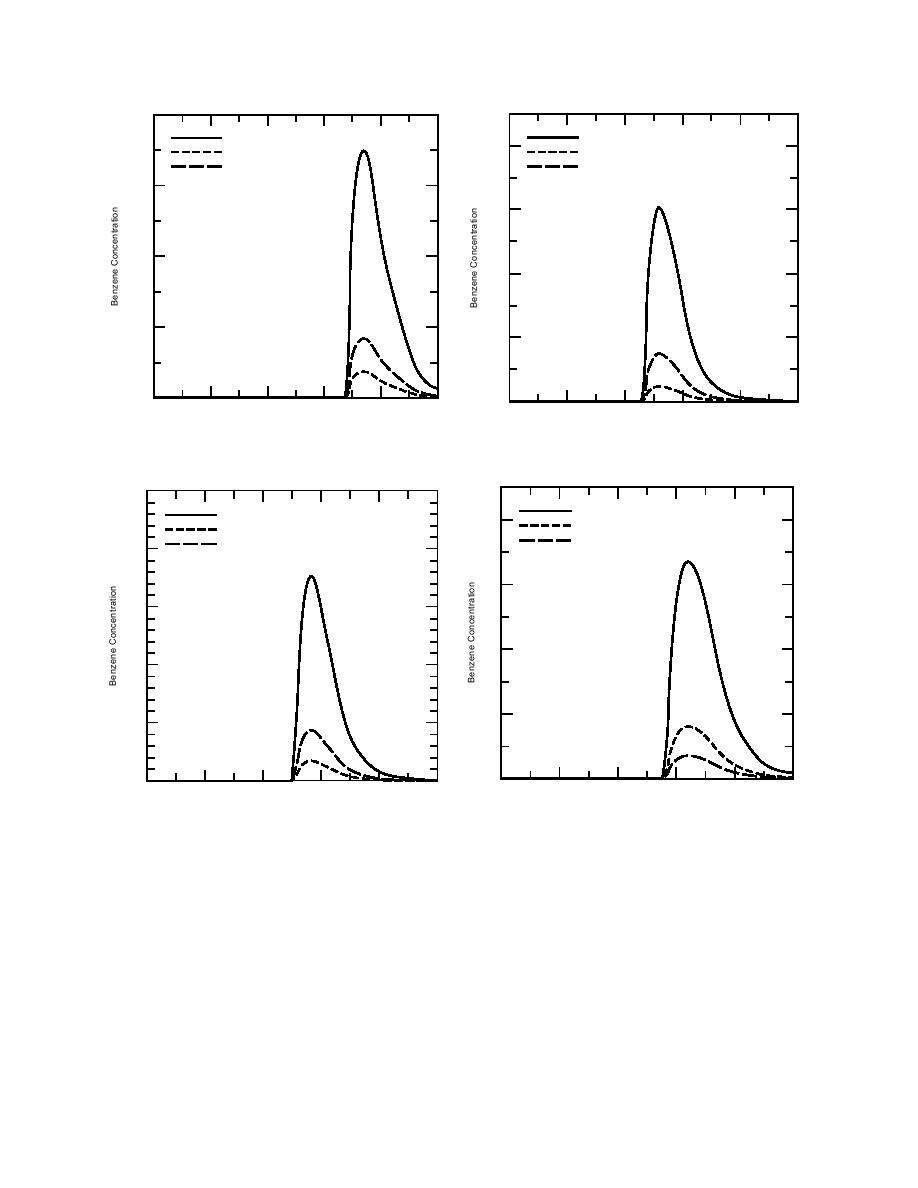
f. Lower soil organic carbon content input parameter
e. Increased porosity input parameter (0.35 compared
(0.09 compared to 0.13%).
to 0.25).
0.25
Dissolved (g /mL)
Dissolved (g /mL)
1.6
Adsorbed (g /g)
Adsorbed (g /g)
3
Air-in-pores (g /cm )
Air-in-pores (g /cm3)
0.20
1.2
0.15
0.8
0.10
0.4
0.05
0
20
40
60
80
100
0
20
40
60
80
100
Time (yrs)
Time (yrs)
g. Lower adsorption coefficient of organic carbon in-
h. Lower biodegradation rate in solid phase input pa-
rameter (2.74 104 compared to 5.48 104).
put parameter (69 compared to 83).
Figure 1 (cont'd).
ble 1, Fig. 1c) and benzene concentration elevated
(1993) results, benzene travel time to the ground-
from 0.04 to 1.84 g/mL. Benzene leached to the
water is increased by 4 years. These results are
groundwater 14 years earlier than in the Drewett
consistent with the observations of Odencrantz et
et al. (1993) estimates. These results agree with
al. (1991) that SESOIL was highly sensitive to the
the findings of Ladwig et al. (1993).
disconnectedness index.
Disconnectedness index
Effective porosity
Decreasing the value of the disconnectedness
Changing the effective porosity from 0.25 to
index (10 to 6.3) lowered benzene concentration
0.35 decreased the peak benzene concentration
(0.01 g/mL) at the bottom of the fourth soil col-
(0.037 g/mL) and increased the peak leach
umn (Fig. 1d). Compared with the Drewett et al.
time by 12 years (Fig. 1e) compared to the
7


 Previous Page
