30
20
10
0
20
40
60
80
100
120
Time (h)
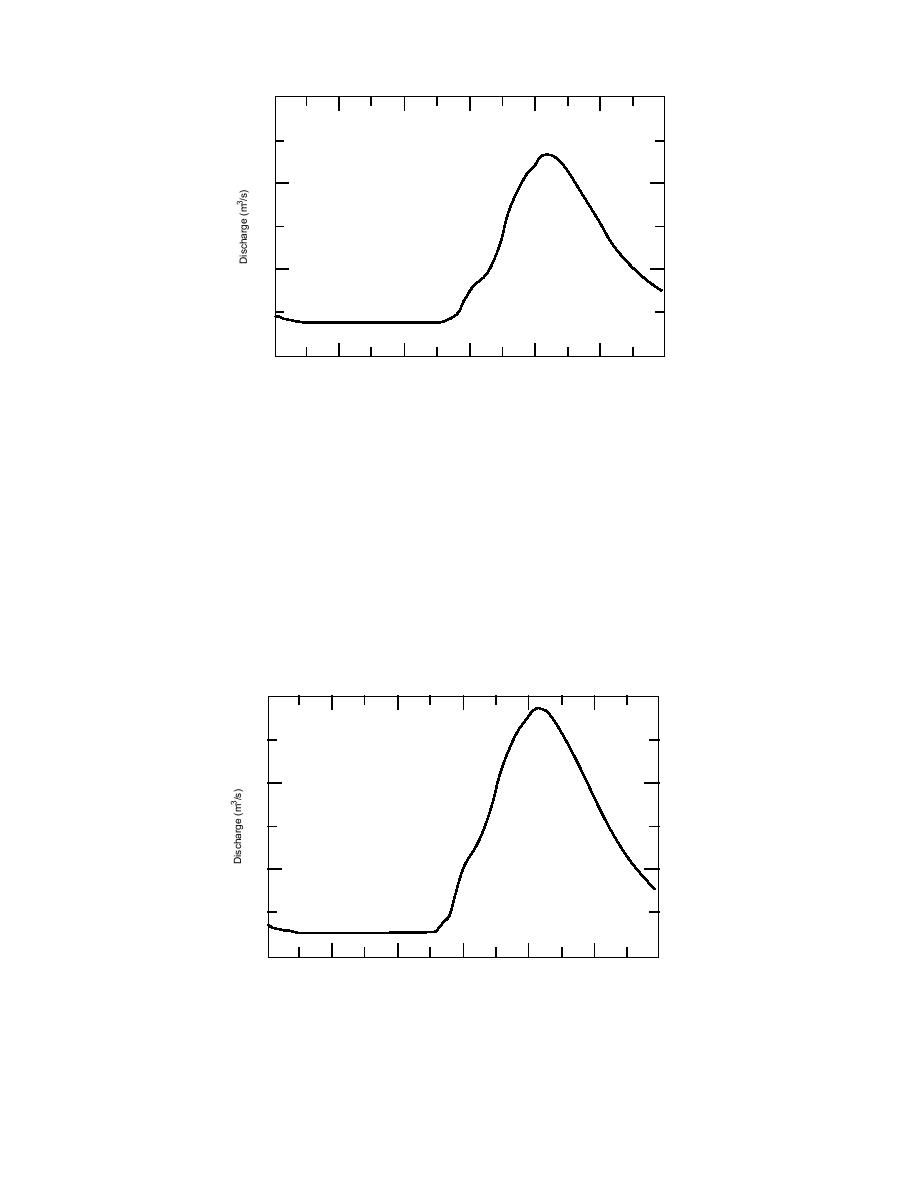
Figure 7. Discharge from an agricultural watershed. The discharge begins to
increase more rapidly at 50 hours, peaks at 84 hours at 23.41 m3/s, then de-
creases until the end of the simulation. This discharge hydrograph increases
and decreases more rapidly, has a larger peak, and peaks one hour earlier than
the discharge hydrograph for the forested watershed. The discharge shown in
this figure and Figure 6 differ because the agricultural watershed produces
more runoff and less subsurface and base flow than the forested watershed .
The impervious part of the suburban watershed was assigned a depression storage of 0.5 mm, be-
cause suburban watersheds usually contain large impervious surfaces (like parking lots) in which
water ponds. This watershed was assigned the smallest values of hydraulic conductivity for all three
watersheds, because the suburban soils were assumed to be the most compacted and therefore less
permeable than both the agricultural and forested soils. Finally, the suburban watershed was assigned
the most impervious area of all three watershed types, because suburban watersheds are more devel-
oped than forested or agricultural watersheds.
Figure 8 shows the behavior of the discharge from a suburban watershed. This hydrograph begins
30
20
10
0
20
40
60
80
100
120
Time (h)
Figure 8. Discharge from a suburban watershed. The discharge begins to in-
crease more rapidly at 50 hours, peaks at 84 hours at 28.63 m3/s, and then de-
scends until the end of the simulation. This hydrograph increases and decreases
more rapidly and has a larger peak discharge than the hydrograph for the agricul-
tural watershed because the suburban watershed produces more runoff and less
subsurface flow and baseflow than the agricultural watershed.
15


 Previous Page
