for each block. Each composited sample was test-
ed using the field method by dividing into sever-
al pans and heating. (One drawback of sieving is
that it also concentrates organic matter that makes
it difficult to spread the sample across a pie
plate in a thin layer.) After removing as much
material as possible from each sample jar for the
field tests, 10.0 mL of isooctane was added to
each jar to rinse the sides and the rinsate analyzed
by gas chromatography.
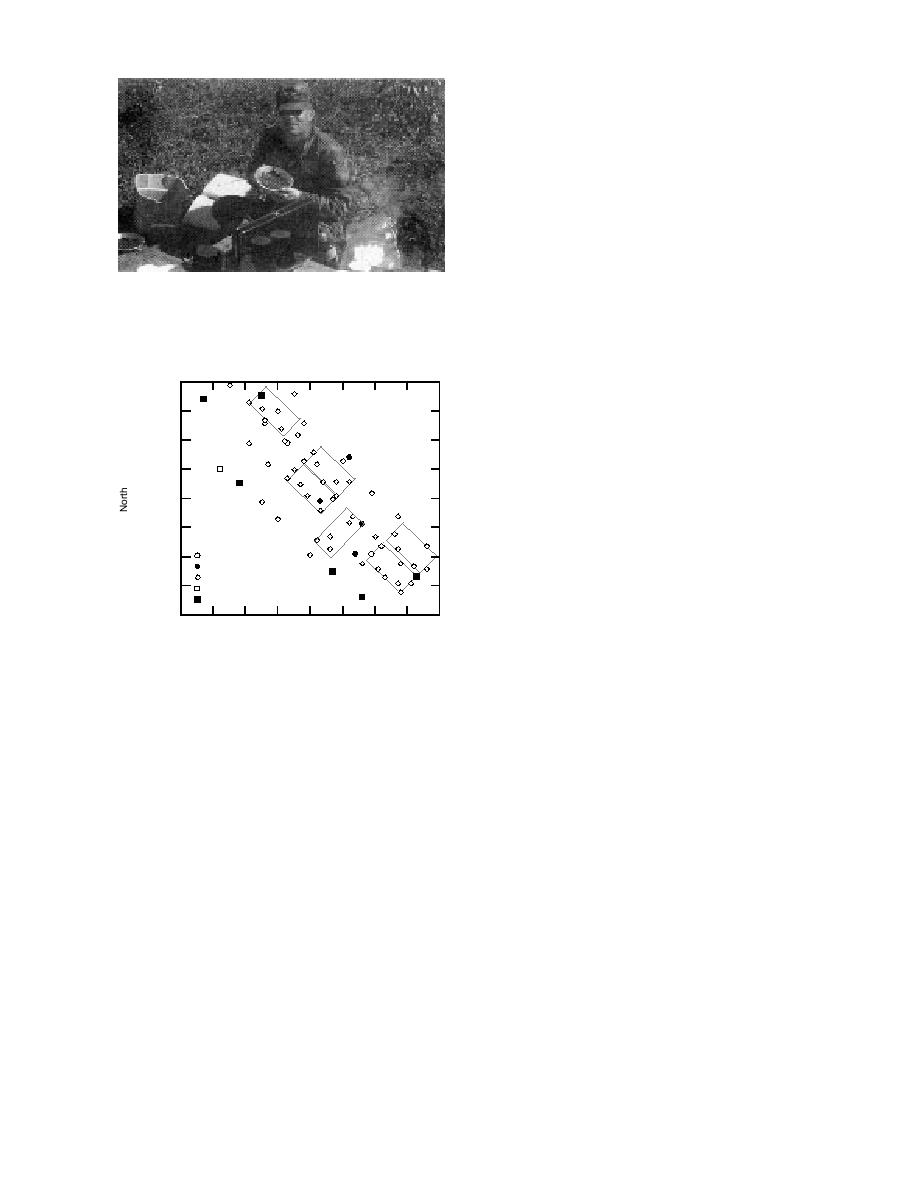
White phosphorus particles were detected in
two of the six areas, four in block 5 and one in
Figure 4. Technician in field examining samples for
block 2. The diameters of the orange spots pro-
evidence of WP particles.
duced during these tests were measured, ranging
from 1.7 to 3.4 mm for the sample from block 5
and 4.9 mm for the sample from block 2. WP was
also detectable in the rinsate from the block 5 and
6,801,370 (m)
block 2 jars and not in the rinsate from the other
jars. Block 5 was the only area where a WP con-
1
centration above 1 g/g was detected previously.
6,801,350
Estimation of
3
WP particle size distribution
This field technique is not quantitative, but it
2
6,801,330
may yield some information on the WP particle
4
size distribution in a subsample. While testing
6
sediment samples using the field method, we no-
> 1 g/g
6,801,310
0.1 to 0.99 g/g
5
ticed that the diameter of the orange residue var-
0.001 to 0.099 g/g
< 0.001 g/g
ied from a fraction of a millimeter to over a centi-
Not Detected
meter. To see if there was a relationship between
6,801,290
the size of a WP particle and the diameter of burn
354,980
355,000
355,020
355,040 (m)
East
residue, in the laboratory we produced spherical
Figure 5. Map showing that WP concentrations and
WP particles ranging in diameter from 0.3 to 1.8
mm and placed the particles in a smear of wet
samples were taken and analyzed by the field test.
sediment in an aluminum pie pan. We then heat-
ed the sample until the water evaporated and the
WP particles ignited. We measured the diameter
sis of the sieved composite. WP concentrations in
of the orange residue produced, and found good
correlation (r2 = 0.903) (Fig. 6) between the diam-
the sieved composite, as determined by the labo-
ratory method, were higher in six out of the seven
eter of the residue and the diameter of the origi-
samples by up to four orders of magnitude than
nal particle.
the discrete sample (Table 2). The higher concen-
tration was caused by preconcentration of white
phosphorus particles or by the increased likeli-
In Eagle River Flats sediments, an orange resi-
hood of hitting a hot spot when taking samples
due may be left by iron fragments and by some
over a large area.
invertebrates that live in the sediments. For ex-
Additional composite samples were taken from
ample, the burned remains of the midge larvae
a ponded area in Eagle River Flats that had been
Chironomus sp., commonly called blood worms,
intensively sampled in the past and where many
were mistaken for the orange residue left by WP
ducks were observed to die of white phosphorus
particles. For a test to be considered positive for
poisoning. The area was divided into six 7.5- m
white phosphorus, the observations should re-
20-m blocks and 25 samples were collected from
quire both a flame and the formation of orange
each block (Fig. 5). These samples were mixed
residue. Adherence to these criteria should elimi-
together and sieved to produce a single sample
nate most false positives.
5


 Previous Page
