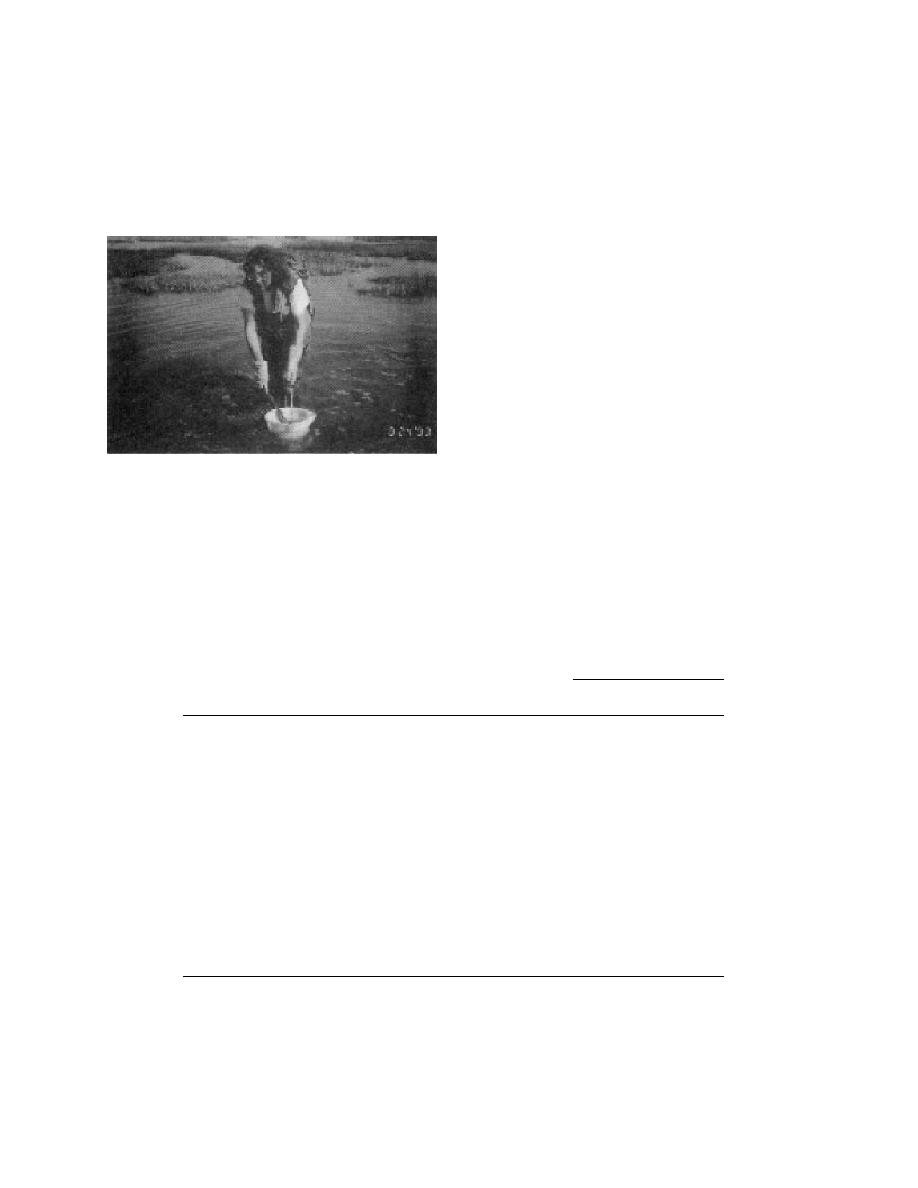
To test the compositing approach to sampling,
a no. 30-mesh (0.59-mm) sieve and a large, long-
two people took samples simultaneously in pon-
handled stainless steel spoon to collect several sed-
ded areas of Eagle River Flats. The first person
iment samples over a radius of up to 5 m or along
chose a site and then took a 500-mL sediment
a transect that included two or more discrete sam-
sample by combining several small samples of
ple sites (Fig. 3). The wash bucket was held un-
the surface sediment within a 0.5-m radius. The
derwater and the sample continuously stirred to
second person used a wash bucket equipped with
reduce the volume. Samples were taken until the
volume of material on the sieve was approximately
500 mL.
Sieved samples were tested for the presence of
WP particles by heating at least four subsamples
in the field. The test was performed by a field
technician with no prior experience using this
test. The technician was instructed to examine
each plate for orange residue (Fig. 4). Then both
sieved and discrete samples were returned to the
laboratory where a subsample was extracted with
isooctane and analyzed by gas chromatography.
Of the 17 samples taken, nine were blank by all
three analyses (Table 2). One sample (no. 12) was
reported to be positive by the field test, but not by
the laboratory method. This result may be due to
Figure 3. Composite samples collected using a large,
heterogeneity in the distribution of particles or by
long-handled stainless steel spoon and wash bucket
flecks of iron in the sample that resemble the
equipped with a no. 30-mesh (0.59-mm) sieve. The
orange burn residue left by a white phosphorus
composite was made from several sediment samples over a
particle. The remaining seven samples were posi-
radius of up to 5 m or along a transect which included two
tive by the field test and by the laboratory analy-
or more discrete sample sites.
Table 2. Number of white phosphorus particles detected in sieved composite sam-
ples by the field method and WP concentration found by the laboratory method in
a separate subsample of each sieved composite.
Number of
WP concentration* (g/g)
Number of
WP particles
subsamples from
detected in
Sieved
Not sieved
Sites
sieved composite
sieved composite
composite
discrete
1
12951296
4
1
0.200
ND
2
1297
6
1
0.034
0.017
3
1292
4
60
603
0.03
4
1289
4
0
0.012
0.068
5
1293
4
59
923
0.34
6
12991300
5
2
26.0
0.42, 0.001
7
1290
4
46
1410
431
8
13011306
4
0
ND
ND
9
1310
4
0
ND
ND
10
1313
4
0
ND
ND
11
1314
4
0
ND
ND
12
1317
4
3
ND
ND
13
1318
4
0
ND
ND
14
1319
4
0
ND
ND
15
1321
4
0
ND
ND
16
1322
4
0
ND
ND
17
132426
4
0
ND
ND
* Determined by laboratory method.
ND = not detected
Note: Also shown are WP concentrations found in discrete samples taken from the same location as
the sieved composites.
4


 Previous Page
