Table 1. Major ice jam events.
Date
Comments
Date
Comments
b. Aroostook River at Fort Fairfield
a. St. John River
3 in. rain with air temperatures 60F. Q
2 in. rain with air temperatures 60F.
30 April 1973
2729 April 1973
at Washburn of 42,400 ft3/s. Q at Fort
River flow Q at Fort Kent was approxi-
mately 136,000 ft3/s with stage of 27 ft
Fairfield of 58,100 ft3/s.
(20-year event).
20 December 1973
1.15 in. rain with air temperatures near
1.2 in. rain with air temperatures 60F.
50F. 1/2-mile jam in Fort Fairfield. Q at
29 April 1974
Washburn only 14,000 ft3/s. Stage of
Q at Dickey was approximately 87,000
ft3/s with stage of 29 ft (elevation
361.7 ft at bridge (est. at 357.7 with no
619.8). Top of ice elevation was report-
ice).
ed to be 621.5 at bridge. Bridge was hit
1.35 in. rain with air temperatures 60F.
1 May 1974
and reportedly moved 4 ft.
Q was 42,800 ft3/s at Washburn and
57,700 ft3/s at Fort Fairfield.
Stage at Fort Kent was 28 ft (25-year
event). Ice hit low steel at bridge (as in
1.6 in. rain with air temperatures 40F.
36 April 1976
1991).
Ice blocks measured to 43 in. Q at
Washburn at 32,200 ft3/s and at Fort
April 1979
Jam reported - No additional informa-
Fairfield at 43,300 ft3/s with record
tion.
stage of 365.6 ft (est. at 360.7 with no
April 1983
Jam reported - No additional informa-
ice).
tion.
1619 April 1983
1.6 in. rain. Q at Washburn approxi-
2 May 1984
26-ft stage at Dickey.
mately 42,500 ft3/s and Q at Fort Fair-
field approximately 58,500 ft3/s.
9 April 1991
Dickey disaster. Maximum ice backwa-
ter stage of 38 ft, 21-ft free flow stage, Q
1314 April 1991
1.7 in. rain. Q at Fort Fairfield of the or-
of 110,000 ft3/s (100-year event), 25-ft
shear walls measured.
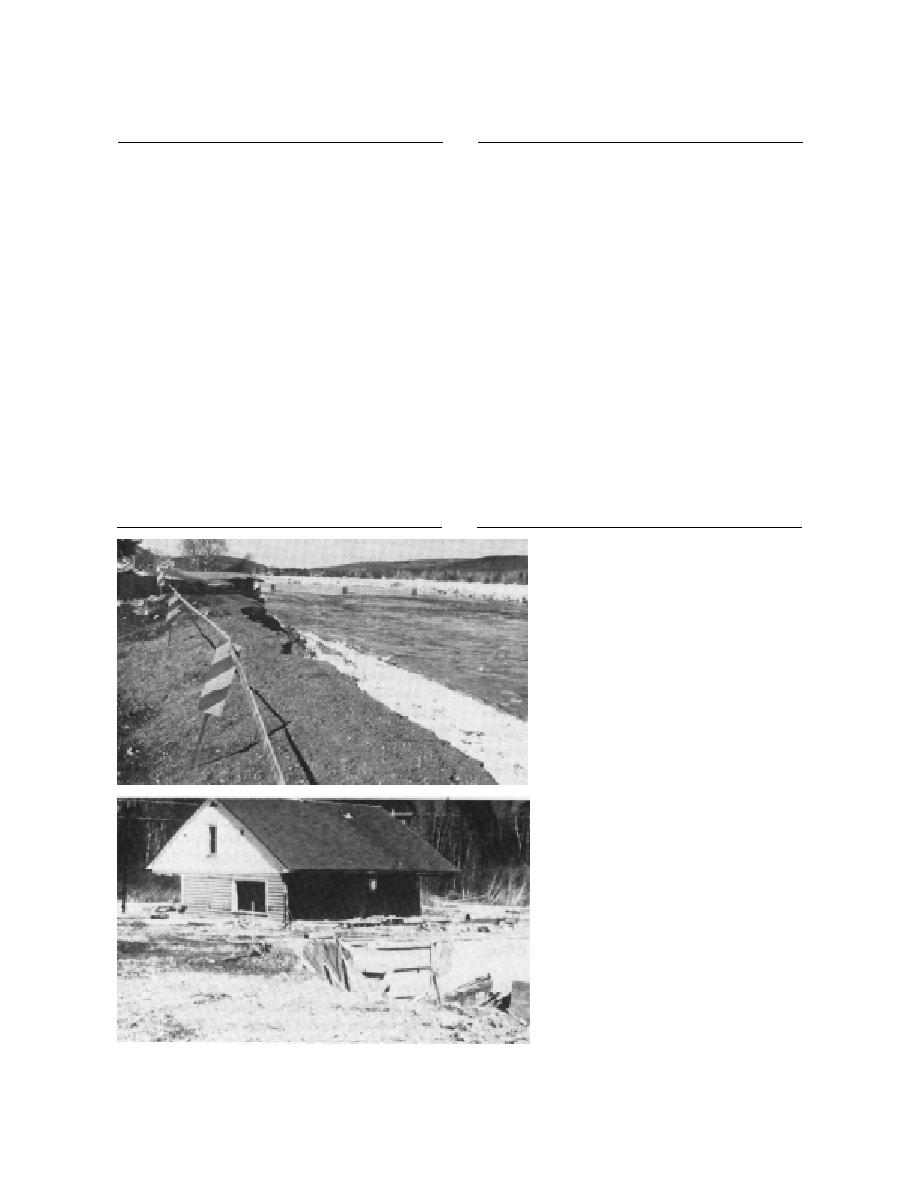
a. Bridge and road section destroyed.
b. Private home moved from foundation.
Figure 1. Ice jam damage in the town of Allagash, Maine, April 1991.
2


 Previous Page
