Table 5. Analyte concentrations (ng/g) for soil subsamples held
at room temperature and prepared for low-level PT/GC/MS analy-
sis.
Analyte
Day 0
Day 5
Day 7
Day 14
Day 21
NaHSO4/22C
1947
22811
2109
23914
21216
TDCE
28618
32512
32314
34718
3186
Ben
25415
29712
29318
34718
2727
TCE
28221
31114
28927
32817
2862
Tol
12
pounds over the 14-day holding period, regard-
Toluene
less of storage temperature. Those prepared for
10
low-level PT/GC/MS and stored at room tempera-
8
ture showed variations in analyte concentrations
6
up to 25%; however, no consistent trends were ob-
Benzene
4
served.
2
MeOH immersion
0
14
28
42
The results for the soil subsamples immersed
H ldi
Ti
(d
)
a. Subsamples immersed in methanol and held at 22C.
in MeOH and held at room temperature are shown
in Table 6. In this experiment there were only small
14
changes in the analyte concentrations for subsam-
12
ples stored over a 42-day period.
10
8
6
Table 6. Analyte concentrations (g/g) for soil sub-
4
samples stored immersed in 10 mL of MeOH and held
2
at room temperature.
0
2
6
10
14
H ldi
Ti
(d
)
Analyte
Day 0
Day 14
Day 28
Day 42
b. Subsamples dispersed into 30 mL of water acidified
with NaHSO4 and held at 22C.
MeOH/22C
2.60.1
2.70
2.80.2
2.60.1
g
(
y)
TDCE
14
4.80.1
4.80.2
4.90.2
5.10.1
Ben
4.30.1
4.30.2
4.40.2
4.30.1
12
TCE
111
111
121
110
Tol
10
8
DISCUSSION
6
4
Since in all of these studies, the soils were forti-
2
fied in an air-filled chamber and the ampoules were
0
opened in VOA vials with at least 14 cm3 of
2
6
10
14
H ldi
Ti
(d
)
headspace, the experimental conditions were aero-
c. Subsample dispersed into 30 mL of water and held
at 4C. (Hewitt 1994c).
bic. Even so, the experimental protocol success-
fully isolated the VOCs, allowing holding time
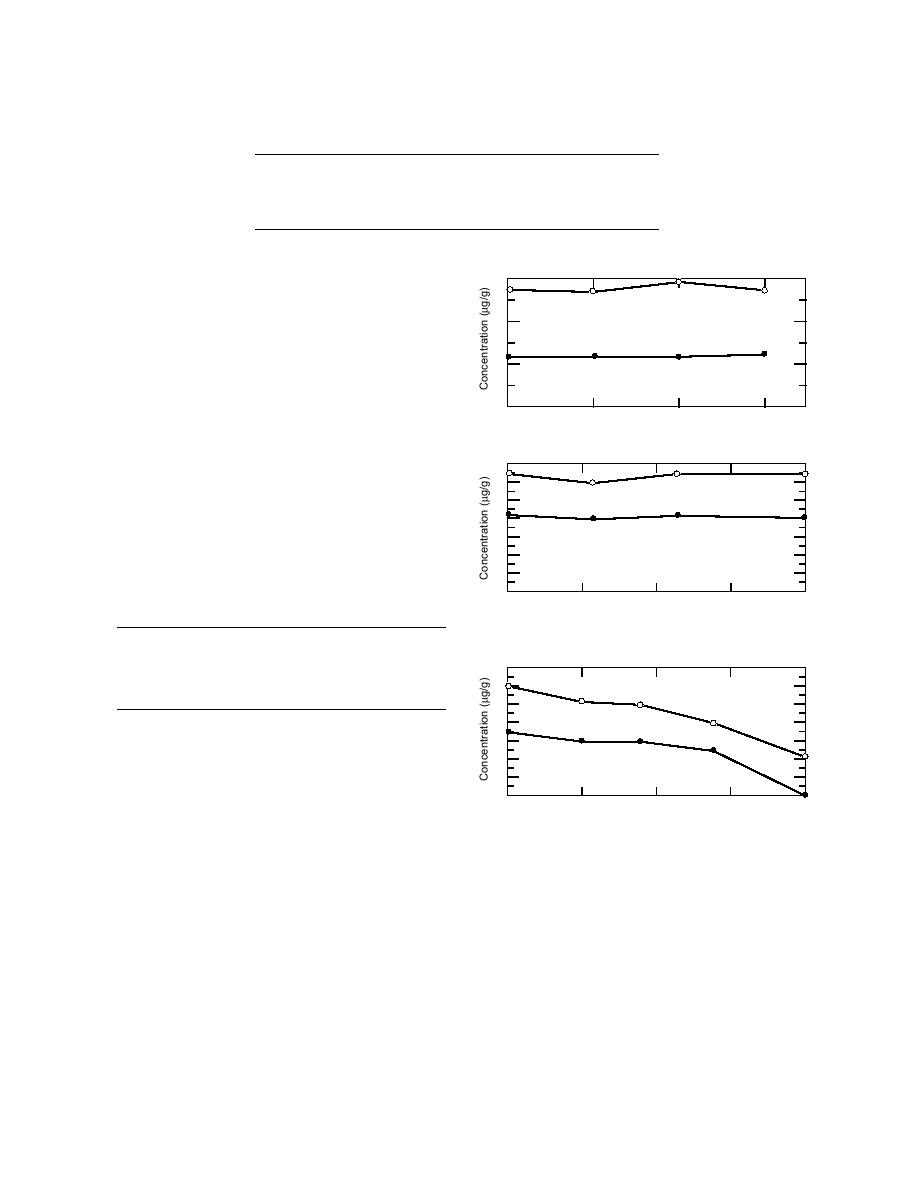
Figure 1. Holding time results for subsamples pre-
studies to address biodegradation in the absence
pared for HS/GC analysis.
of volatilization. For example, TDCE, the analyte
with the highest vapor pressure, was remarkably
stable in concentration over periods exceeding 14
(Suflita 1989). This feature is illustrated in Figures
days. A similar stability in concentration was also
1 and 2, which show the results for subsamples
observed for TCE. In contrast, Ben and Tol often
stored with and without chemical preservation.
underwent rapid reductions in concentration un-
Figure 3 is a plot of the percent cumulative VOC
less the subsamples were chemically preserved, a
concentration relative to day 0 for the treatment
process that has long been suspected, since these
level experiment (Table 3). Also included in this
two aromatic compounds aerobically biodegrade
plot are the results from a previous study (Hewitt
5


 Previous Page
