6.2 Validation
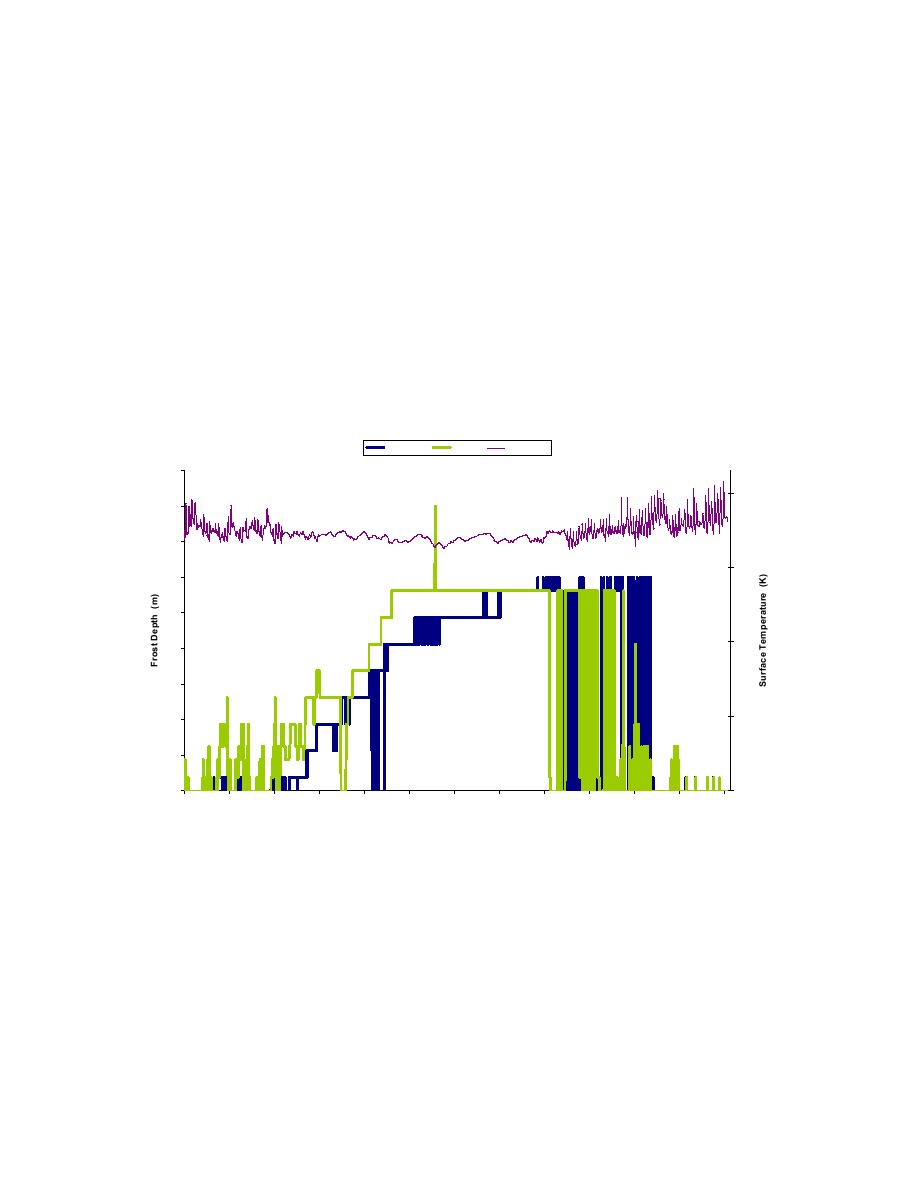
We tested the freeze/thaw module using the data collected by Lindamae Peck in South
Royalton, VT, spanning the winter of 19901991 (personal communication). The site had
silty soil of which the density, porosity, and thermal conductivity had been measured
(Peck and O'Neill 1997). Figure 8.1 compares the frost depth as extrapolated from the
thermister probe to those calculated by FASST. FASST was initialized with two soil
layers, the top one a silty sand (SM) 0.10 m thick and the bottom layer an organic silty
clay (OL) 1.40 m thick. The FASST determined surface temperature denoted "st FASST"
is also shown in Figure 8.1. The largest differences between the calculations and the
measurements occur during the thawing period. FASST partially thaws a few days before
the measured values. This is in part due to differences in the snow meltout date between
the model and the observations as discussed below. Shifting of the surface probe during
the winter is also to blame.
South Royalton, VT 1990-91
measured
FASST
st FASST
0.9
300
0.8
0.7
250
0.6
0.5
200
0.4
0.3
150
0.2
0.1
0
100
33178
33193
33208
33223
33238
33253
33268
33283
33298
33313
33328
33343
33358
Julian Day
Figure 6.1 Comparison of frost depth between FASST and measured values for South
Royalton, VT.
Figure 6.2 shows that several daily shallow freeze/thaw events happen before and after
the first snow. This is a common occurrence in temperate climates. From Figure 6.2 one
can also discern that when there is snow present (measured values), FASST accurately
predicts the frost depth. Differences between FASST and measured values can be due to
the thermister string spacing. Another reason could be how "frozen soil" is defined
between the two. FASST considers a node frozen if there is any ice present while the
measured value is strictly defined by temperature. FASST does a fairly good job at
56


 Previous Page
