APPENDIX D: TEMPERATURE PROFILES FROM
THE PEGASUS RUNWAY ICE
Temperature profiles within the ice along the
following season (199394). Decisions about place-
east edge of the runway were automatically re-
ment and removal of snow cover for the runway,
corded during the 199293 and 199394 austral
proof rolling, and when to allow aircraft access
summer seasons. Type T thermocouple strings
were based on these data.
were installed in the ice extending down to a
Figures D8D14 portray the average daily ice
depth of about 1.5 m (5 ft). Thermocouple leads
temperature corresponding with Figures D1D7.
were brought into a snow-covered weather-proof
In part, the effectiveness of the runway snow cover
in protecting the ice from solar radiation can be
box and connected to a Campbell Scientific data
judged by the difference between maximum and
logger.
average daily temperatures. Processing of the pro-
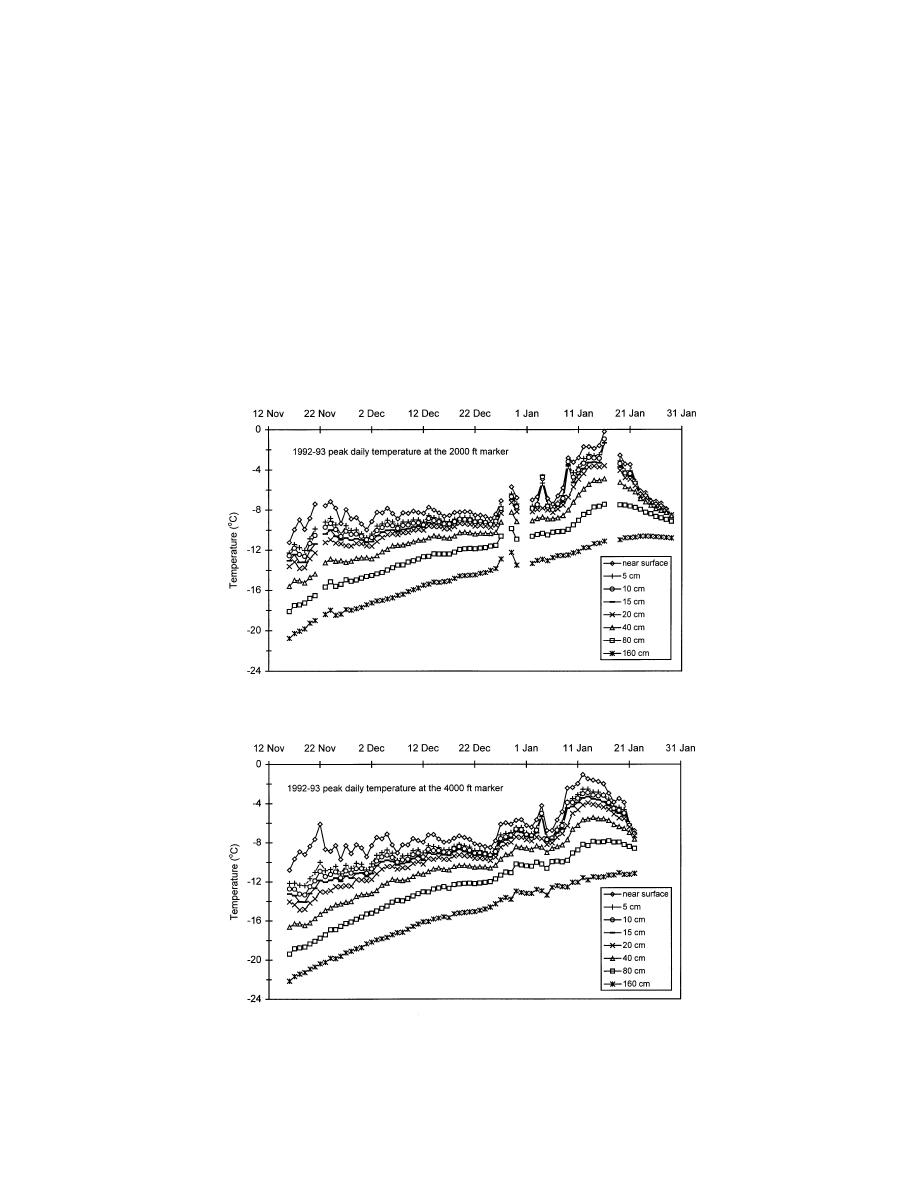
Figures D1D4 show the daily peak ice tem-
tective snow cover is required when the peak and
perature measured at various depths in the ice
average temperatures differ by more than a few
during the 199293 operational season. Figures
degrees.
D5D7 present the peak temperatures during the
Figure D1. Peak daily temperature in the runway ice at the 2000-ft station
during the 199293 austral summer.
Figure D2. Peak daily temperature in the runway ice at the 4000-ft station
during the 199293 austral summer.
115


 Previous Page
