in the center of the failed zone. Slabs could
sometimes be seen displaced upwards a few
centimeters along the edges of the failure
area. When removing the ice blocks from
these areas, we often observed a crushed
and crumbled zone along the lower sides of
the scooped-out bowl. In some cases, a shale-
like structure could be seen in the bottom
and sides of the bowl extending into the
sound ice (Fig. 53). The area of individual
failure zones varied from about 0.11.1 m2
(110 ft2) and they were 7.545 cm (318 in.)
deep.
A sketch map of the failed zones (Fig. 54)
shows a concentration in the 5000- to 7000-ft
region. This is the area that had a natural
depression and was manually filled with
water in November of 1991. This area did
not completely freeze until after February
(1992). The other failures also tended to be
concentrated into areas where known sub-
surface melt pools had formed the prior year.
No failures were experienced in the natural
glacial ice.
Cores were drilled in the immediate vicin-
ity of a number of failure zones. The cores
confirmed that the ice at these locations was
meltwater ice. This ice was very brittle and,
occassionally, contained many visible but
closed cracks. It is difficult to tell exactly
what caused the cracks to form, but likely
possibilities include 1) release, by coring, of
trapped stresses in the meltwater ice, 2)
cracks induced by aggressive grading of the
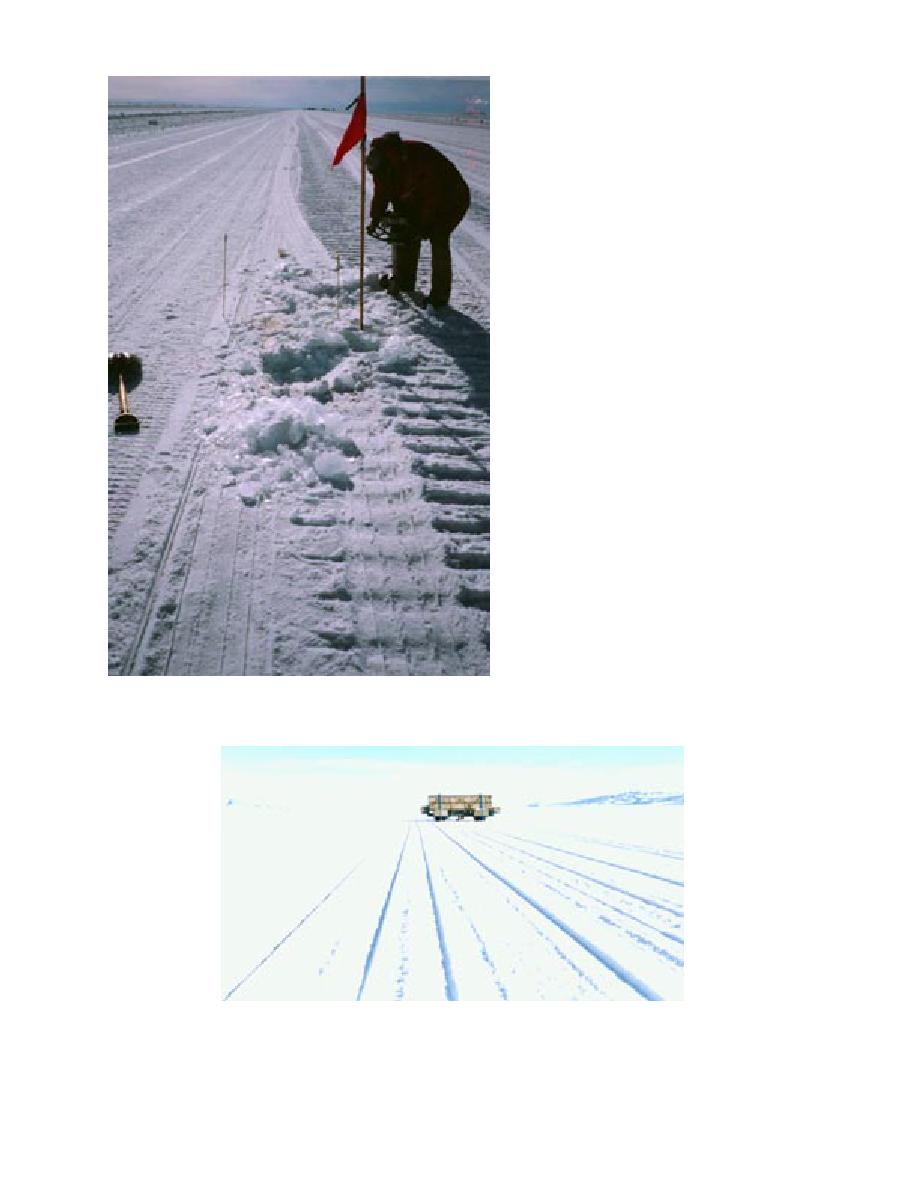
Figure 51. Site of failed runway ice caused by proof cart.
ice surface, and 3) cracks formed during
Figure 52. Closely spaced proof cart tire tracks during full-scale load certifi-
cation of runway.
50


 Previous Page
