The peak in reflectance is largely due to specu-
0.20
lar reflection of the direct solar beam. Specular
d
reflection is light reflected from the surface of the
medium in the direction of the angle of reflec-
0.16
tion. Its magnitude depends on the angle of inci-
dence and the index of refraction according to:
1 sin 2 (θ - φ * ) tan 2 (θ - φ * )
Ir (θ) = I0 (θ)
+
0.12
2 sin 2 (θ + φ * ) tan 2 (θ + φ * )
where I0(θ) = the incident direct solar beam ra-
0.08
diance,
Ir(θ) = the reflected radiance
c
θ = the zenith angle of incident and
reflected radiance
0.04
θ∗ = [n arcsin(θ)]1
b
dium (Born and Wolfe 1965).
a
0
400
500
600
700
800
As the zenith angle increases (sun gets closer to
Wavelength (nm)
the horizon), the specular reflection increases. The
specular component is larger for smooth surfaces
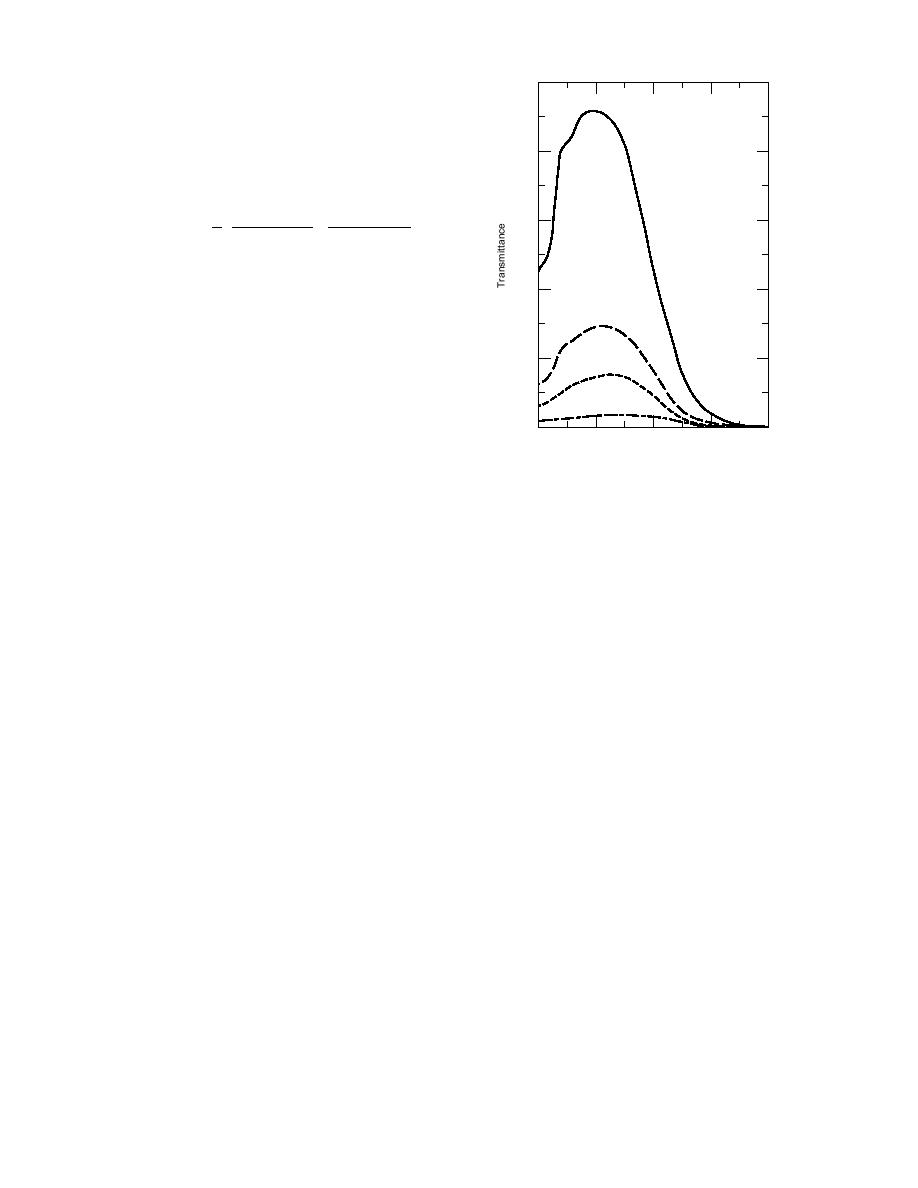
Figure 14. The influence of surface conditions
such as blue ice or melt ponds and smaller for
on light transmission (from Maykut and Grenfell
rough surfaces such as snow or drained white
1977). In all cases the ice thickness was 1.85 m.
ice.
Surface conditions were a) blue ice covered by
0.25 m of melting snow, b) blue ice covered by
Transmission
0.12 m of melting snow, c) white ice and d) blue
The magnitude and spectral distribution of
ice covered by a 0.05-m melt pond.
light transmitted through the ice cover depends
on the physical composition of the ice, the thick-
duce light transmission and change its spectral
ness of the ice, and the surface conditions. As
composition (Maykut and Grenfell 1975, Soo Hoo
thickness increases, light transmission through the
et al. 1987, Perovich et al. 1993). As an example of
ice drops off roughly exponentially. The influ-
this, spectral transmittances for 1.5-m-thick first-
ence of surface conditions on light transmission
year ice with a 0.05-m snow cover and with a
through the ice is illustrated in Figure 14 (Maykut
0.19-m snow cover are plotted in Figure 15. Sur-
and Grenfell 1975). Even a thin (0.25-m) layer of
prisingly, the transmission is less under the thin-
highly scattering snow can reduce transmittances
ner snow cover. This is a direct result of a 50%
through the ice cover to less than 1% (curve a). As
higher algal biomass (157 vs. 117 mg chlorophyll
m2) at the thin snow site. In addition to the over-
the snow melts, scattering decreases and the trans-
mittance increases (curve b) until the snow is gone
all reduction, the presence of the additional bio-
(curve c). The presence of melt ponds greatly re-
mass results in enhanced losses in the blue end of
duces scattering in the upper portion of the ice
the spectrum and a pronounced drop in transmit-
and enhances transmission in the visible (curve
tance at 670 nm.
d). Light levels beneath ponded first-year ice are
at least a factor of three greater than those be-
Extinction coefficient
neath white ice of the same thickness (Grenfell
A more fundamental way to characterize light
and Maykut 1977).
penetration through sea ice is by an extinction
coefficient (κλ). The extinction coefficient is a mea-
Sea ice can be a prime habitat for biological
organisms. The growth of these organisms is in-
sure of loss due to scattering and absorption and
fluenced by the amount of light available in and
is typically determined from measurements of
under the ice (Soo Hoo et al. 1987, Cota and Horne
incident, reflected and transmitted light. Trans-
1989, Arrigo et al. 1991). Just as the ice biota are
mission measurements are difficult and demand-
affected by the light levels, they in turn can re-
ing, and consequently there have been far fewer
12


 Previous Page
