Home
Download PDF
Order CD-ROM
Order in Print
Home
>
Cold Research and Engineering Laboratory Reports
>
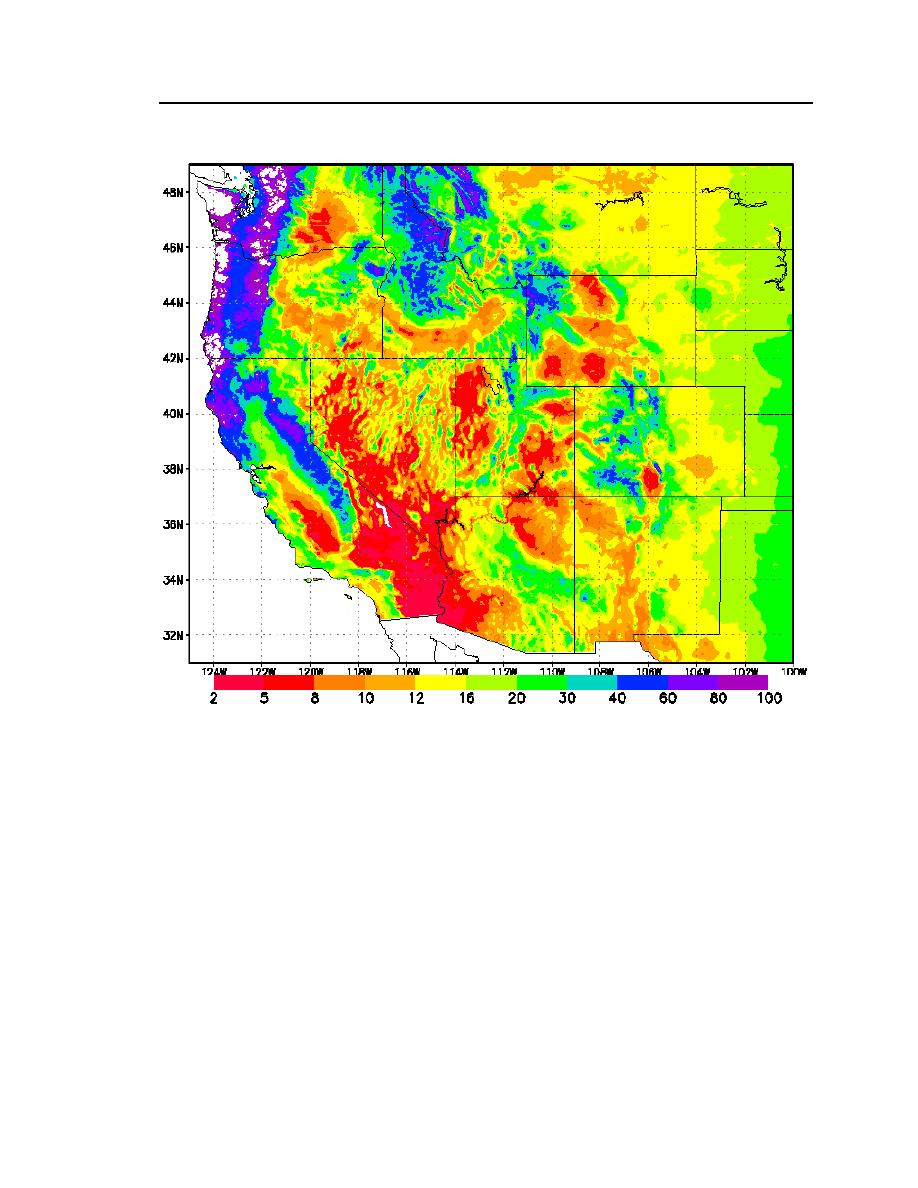
> Figure 3. Average annual precipitation in the western U.S. for 19611990, showing the extreme variability in rainfall in the Southwest
HYDROLOGY
Meteorological Sources of Moisture
ERDC-TR-04-1
Page Navigation
15
16
17
18
19
20
21
22
23
24
25
Chapter
2.
Hydrology
19
Figure 3. Average
annual
precipitation
in
the
western
U.S.
for
19611990,
showing
the
extreme
variability
in
rainfall
in
the
Southwest.
The
precipitation
totals
are
in
inches.
(From
http://www.wrcc.dri.edu/images/west.gif.)