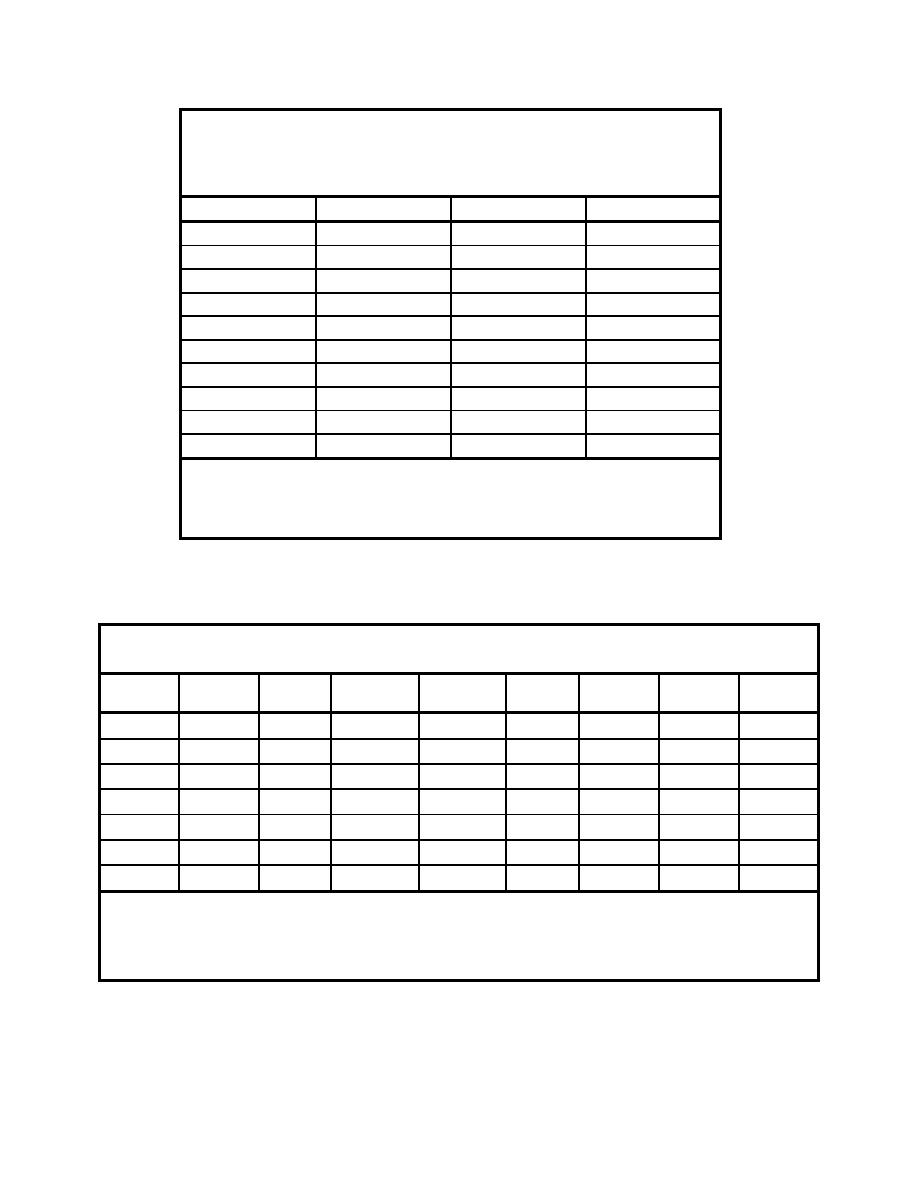
Table 9
Seepages Around the Perimeter of the Artillery Range at Fort
Lewis1
2
3
3
Sample Number
CRREL
EL
Anteon Corporation
MW1
0.28
0.38
0.3
MW2
0.19
0.27
0.2
4
MW3
0.18
na
0.2
MW4
0.51
0.59
0.5
5
MW7
<0.1
na
<0.2
A1ASP01
0.31
na
0.4
A1ASP02
0.15
na
0.2
A1ASP03
0.26
na
0.3
A1ASP04
0.73
na
0.8
A1ASP05
<0.1
na
<0.2
1
Samples were collected in August 2000. RDX was the only analyte detected.
2
Analyzed by Method 8095, GC-ECD (USEPA 1999).
3
Analyzed by Method 8330, RP-HPLC-UV (USEPA 1994).
4
Sample not analyzed by this laboratory.
5
Less than detection limits.
Table 10
Nitrate/
1
Well
Calcium
Iron
Magnesium
TOC
Sulfate
Chloride
Nitrite
<3.03
13J4
2
MW01
2.0J
8.60
0.069
0.007
2.96
0.37
MW02
9.47
<0.02
<0.001
3.63
0.23
<3.0
6.4J
2.1J
MW03
7.87
0.048
0.002
3.05
0.26
<3.0
<20
1.7J
MW04
7.70
<0.02
<0.001
2.67
0.35
<3.0
<20
2.0J
MW07
11.5
0.319
0.014
4.86
1.6
<3.0
<20
1.6J
5
A1ASP03
7.10
0.029
0.004
2.45
0.055J
<3.0
<20
1.6J
A1ASP05
7.66
<0.02
<0.001
2.31
0.44
<3.0
<20
2.2J
1
Total organic carbon.
2
Monitoring well number.
3
Less than detection limit.
4
J values are below the statistically reliable detection limit.
5
Seepage area number.
45
Chapter 2 Characterization of Explosives Contamination at Military Firing Ranges


 Previous Page
