1.4
80
5 cm
70
1.2
10 cm
Tension
60
1.0
50
0.8
12
40
Jun
0.6
30
23
Aug
0.4
20
d. 1998 Transect location
0.2
100 m.
10
0.0
0
1.2
5 cm
10 cm
1.0
20 cm
30 cm
0.8
0.6
e. 1998 Area C piezometer site.
10
23
Jun
Aug
0.4
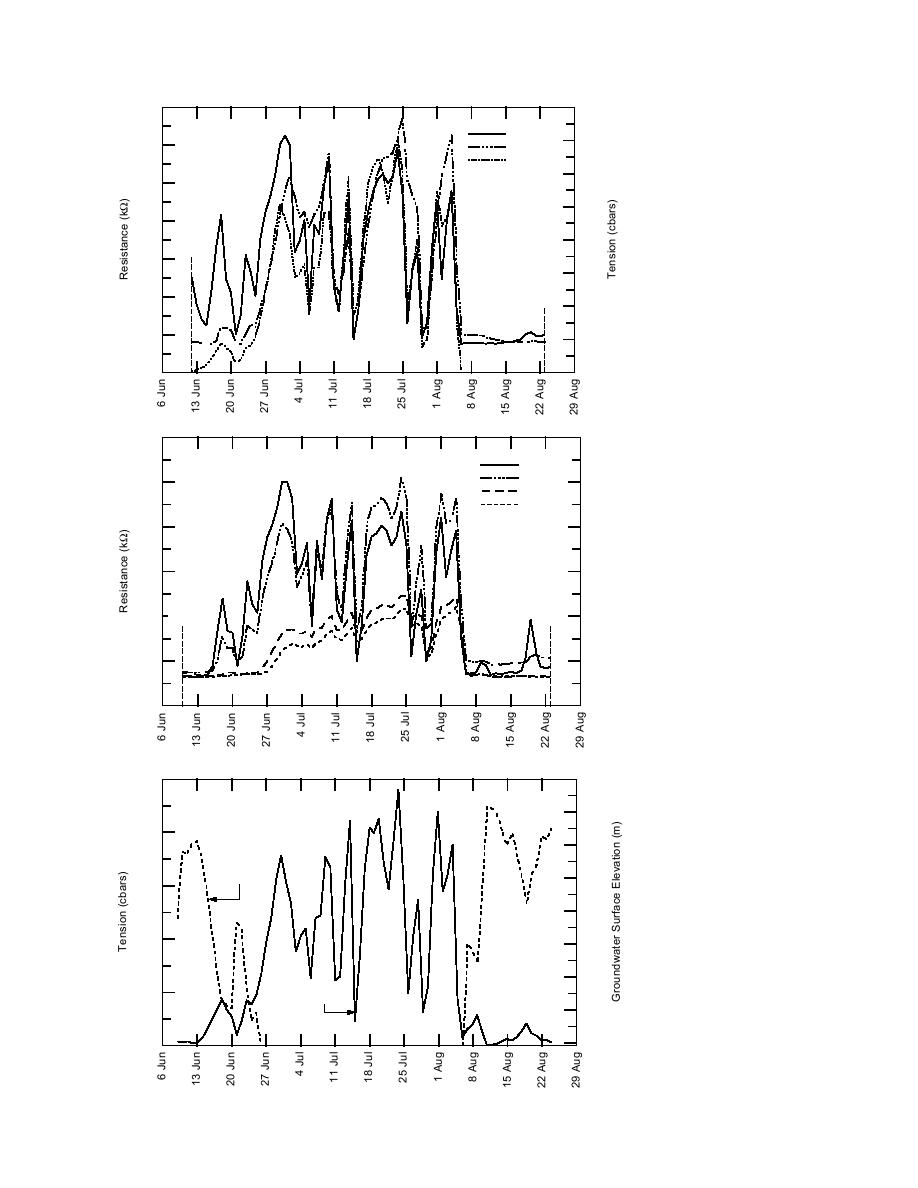
Figure 13 (cont'd). Area C mois-
0.2
ture probe sensor output (1997
98). Note: Increasing resistance
denotes drying of sediment.
0.0
50
4.8
4.7
40
4.6
Surface
Elevation
4.5
30
4.4
20
4.3
4.2
10
Tension
4.1
Figure 14. Groundwater ele-
4.0
vation and surface moisture
0
content in Area C (1998). Note:
Surface elevation is 4.77 m.
18


 Previous Page
