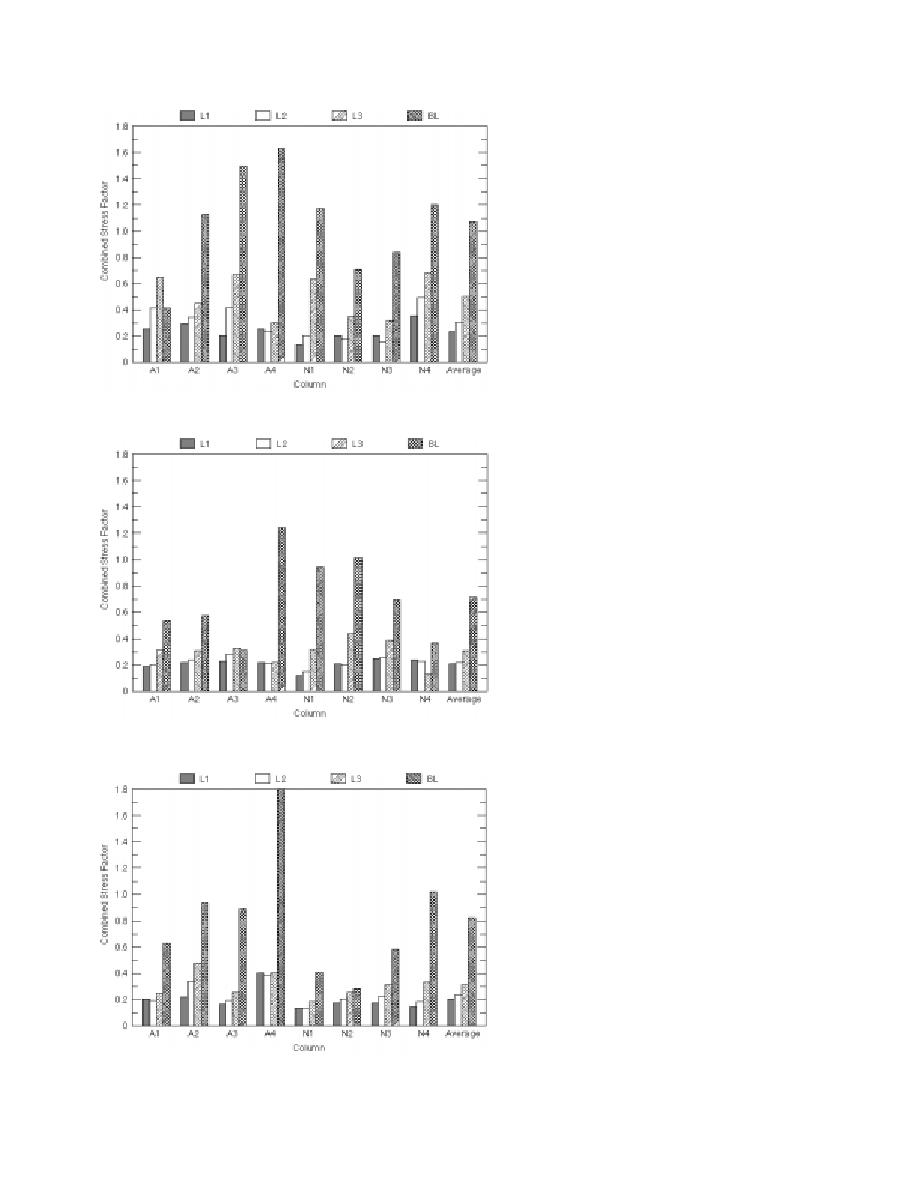
not done. From the data, one can see a rise
in the general state of stress in the struc-
ture, especially in column A4, which has a
combined stress factor well in excess of
1.60. Extrapolation of this and previous
years' data indicated a combined stress
factor of more than 2.00 by year's end (Fig.
20).
Figure B4. Swaybolt loads: 1986.
Figure B5. Swaybolt loads: 1987.
Figure B6. Swaybolt loads: 1988.
22


 Previous Page
