60
1983
1984
50
1985
1986
1987
40
1988
30
20
10
0
A1
A2
A3
A4*
N1
N2
N3
N4
Avg:
Avg:
A
N
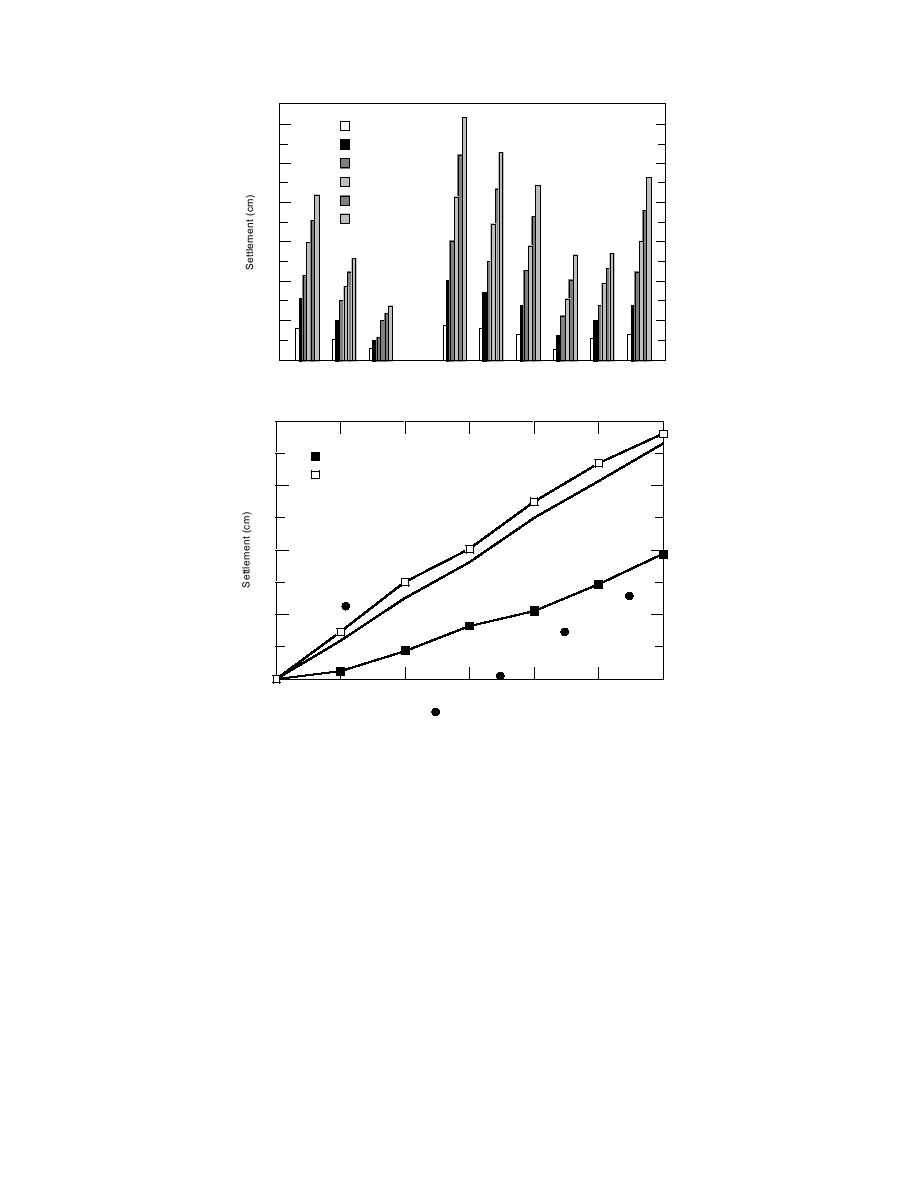
Figure 13. Footing settlements: 19821988.
40
Average: A-N (across)
Average: 4-1 (along)
30
Average: All
20
10
0
1982
1983
1984
1985
1986
1987
1988
Year
Figure 14. Footing settlement trends.
rows while across-row settlements were normal-
at differing rates. Figure 13 shows the settlements
ized to the A row. One important note to make here
of the A and N row of columns, as well as the av-
is that in August of 1988 approximately 2 m
erages of each respective row. Footing A4 was
(6 ft) of water and ice was present in footing N1
used as the datum point as this was the slowest
(Fig. 15). This was an accumulation of over a
settling footing and was used as the "baseline"
meter (4 ft) since June of that year. The effect of the
footing previous to the move in 1982. Therefore
presence of this much water in the column footing
no settlements are given for it.
may have led to weakening of the underlying
From these figures, several observations can be
packed snow foundation or even voids, depend-
made. The most obvious is that the N row is set-
ing on the amount of heat given off during the
tling faster than the A row. The average rate of
transformation of the water to ice and the contri-
settlement of the N row with respect to A4 is 0.08
m/year. The settlement of columns A1 through
bution of the structural members within the foot-
ings to the dissipation of this heat. As the mean
A3 with respect to A4 is only 0.05 m/year. Foot-
annual temperature at DYE-2 is around 16.6C,
ing settlement data can be found in Walsh (1992).
The across-row settlement as well as the along-
there is a good chance some melting of the foun-
row settlements for both rows show similar
dation may have occurred. However, with no bor-
trends. Figure 14 shows these settlements for the
ings conducted to verify this hypothesis, we can
years 1982 to 1988. Along-row settlements were
only postulate that the foundation was adversely
normalized to A4 and N4 for their respective
affected by the presence of this water.
11


 Previous Page
