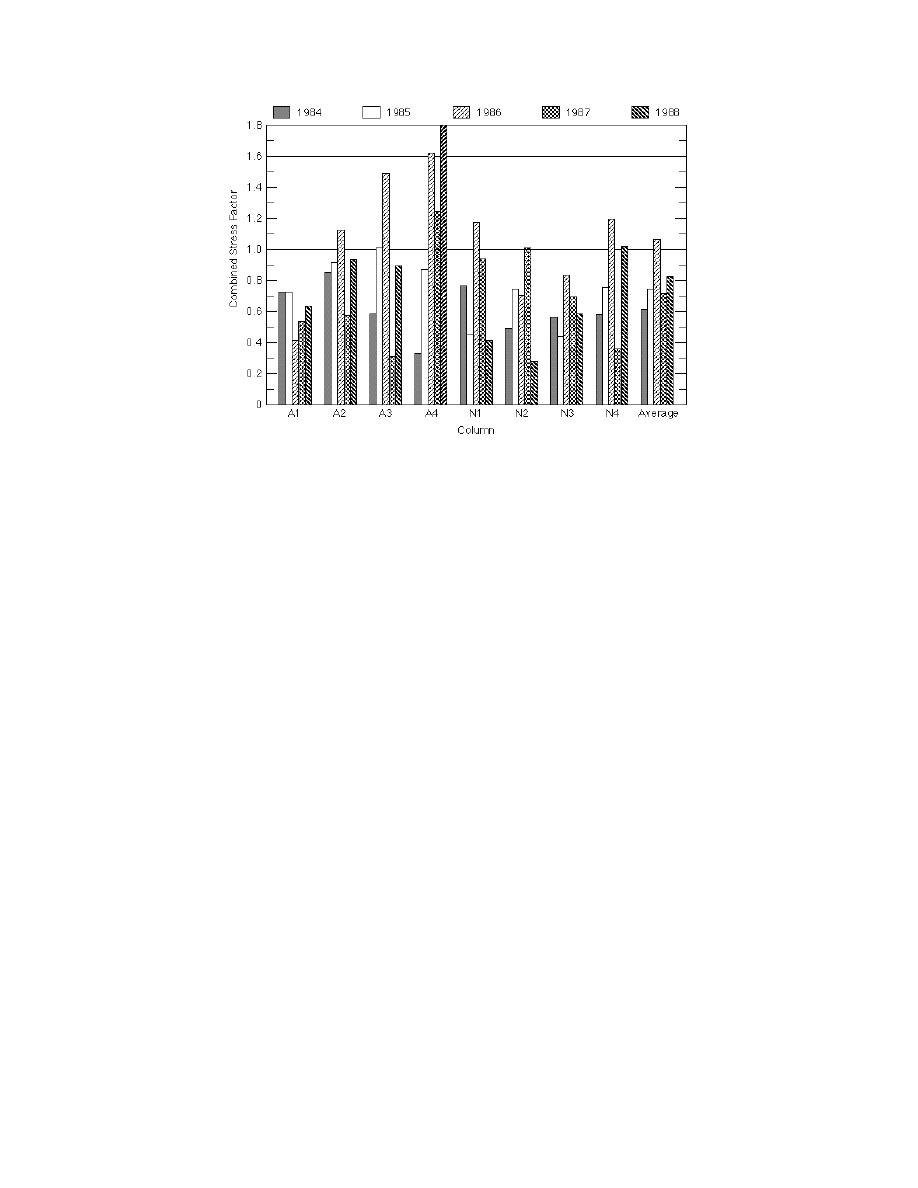
Figure 12. Summary of base level stress concentration factors: 1984-1988.
for 1988 show a return to the previously devel-
low, with an average base level combined stress
oped stress pattern. The average BLCSF has in-
factor (BLCSF) of about 0.61. BLCSFs are calcu-
creased to 0.82, up over 15% from 1987 but still
lated loads on the column bases caused by stresses
below 1986. The A row columns are much more
measured in the four collars of each column. There
highly loaded than the N row and the rear truss
is no obvious pattern to the stress levels. None of
system is more highly loaded than the forward.
the column BLCSFs exceed 1.00. In 1985, the
The stress factor for A4 has increased from 1.24 to
stresses have become redistributed. The average
1.80, or 45%. Columns A3 and A4 have both in-
BLCSF has increased to 0.71, with one column
creased over 60%. Two column BLCSFs exceed
exceeding 1.00. Again, no pattern is obvious,
1.00, while two more are rapidly approaching 1.00
although the A row is more heavily loaded than
From the data on hand, a predictable pattern
the N row.
has emerged. When the column bases and build-
By 1986, a pattern has emerged. In the A row,
ing/truss system are leveled, a general reduction
the BLCSFs steadily increase from A1 to A4. The
and redistribution of stresses occurs. Following
same applies to the N row with the exception of
these operations, the base level combined stress
N1. The A row is more heavily loaded than the N
factors along the A row increase faster than along
row, as was seen in 1985. The columns contained
the N row, the rear truss system columns become
by the rear truss system (A3, A4, N3, N4) have
more highly loaded than those contained by the
higher BLCSFs than their counterparts contained
forward system, and column A4 develops signifi-
by the forward truss system. The loads are signifi-
cant base level stresses. The driving force for the
cantly higher than in 1985. Five columns have a
stress increases, and the persistent stress pattern
BLCSF in excess of 1.00, with A4 at 1.62. The aver-
may be column footing settlement and tilt, which
age BLCSF also exceeds 1.00, up 36% from 1985 to
will be examined next.
1.07.
With the column bases jacked and releveled
and the building and trusses releveled in 1987, we
FOOTING SETTLEMENTS AND TILTS
see a general decrease in stress factors. The aver-
Footing settlement has been measured on a reg-
age BLCSF drops from 1.07 to 0.71, a decrease of
ular basis since the move in 1982. This has usually
over 33%. Only two-column BLCSFs now exceed
been the responsibility of the CRREL survey team
1.00. Column A4, which was at 1.62, has dropped
with assistance from the stress measurement
to 1.24, a decrease of 23%. The two truss systems
team. The causes of footing settlement have been
are now more evenly loaded. The stress pattern
mentioned in the Structural Influences section and
seen in 1985 and 1986 has disappeared, with the
will be reviewed in more detail here.
exception that A4 is still highly loaded. The data
9


 Previous Page
