6000
DB-1
5000
LV = 40 cm/s
4000
3000
2000
1000
0
4
6
8
10
12
0
1
2
3
5
7
9
11
13
Time (minutes)
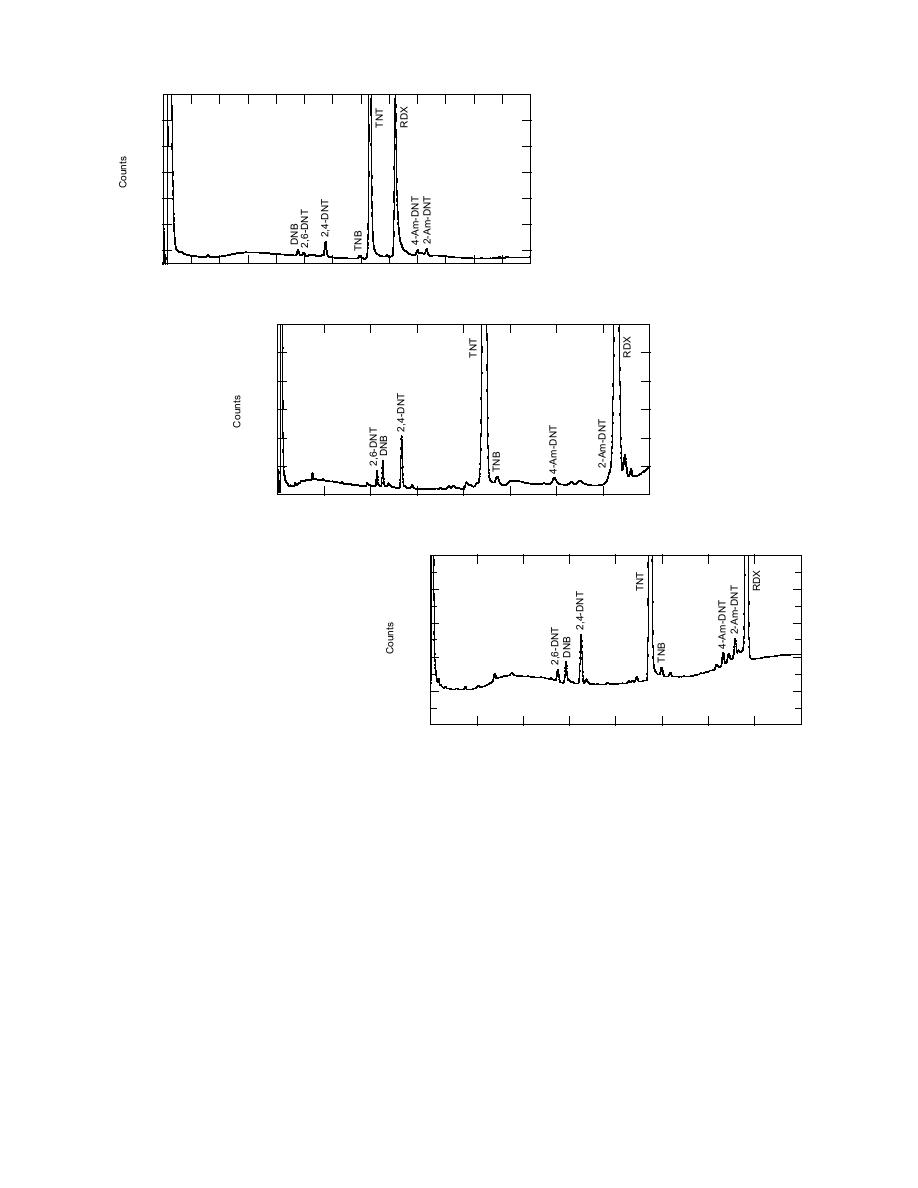
a. DB-1 analytical column.
6000
RTX-200
5000
LV = 40 cm/s
4000
3000
2000
1000
0
0
4
8
12
16
20
24
28
32
Time (minutes)
b. RTX-200 confirmation column.
10000
RTX-225
LV = 108 cm/s
8000
6000
4000
2000
0
0
2
4
6
8
10
12
14
16
Time (minutes)
c. RTX-225 confirmation column.
Figure 7. Chromatograms for one water sample obtained from LAAP.
quired dilution prior to GC-ECD analysis so that
GC the peak we observe actually corresponds to a
peak heights would fall within the linear calibra-
thermal degradation product of tetryl, possibly
tion range. Dilution actually appeared to im-
n-methyl-picramide (Tamiri and Zitrin 1986). Sev-
prove the accuracy of the GC determination of
eral LAAP water samples are also contaminated
HMX when several samples were run sequen-
with picric acid, and an unidentified co-contami-
tially. We suspect that dilution served to "clean
nant of picric acid is potentially the source of the
up" the extracts, diluting residual water and
peak we observe on the GC. Finally, 2,6-DNT was
slowing the degradation of the deactivation layer
detected by GC-ECD in almost every sample that
in the injection-port liner and the buildup of non-
contained 2,4-DNT. These isomers often coelute on
volatile coextracted contaminants that deposit in
the LC18 separation specified in Method 8330.
the injection-port liner. Accurate determination
However, these isomers can be resolved on other
of HMX required that the injection-port liner be
LC columns (Walsh et al. 1993), specifically those
with 3-m phase particles, which are less rugged
changed frequently. We changed the liner each
time we replaced the injection-port septum, at
for routine analysis of large numbers of samples.
least every 50 injections.
Almost all the extracts from field samples re-
14


 Previous Page
