10
30
Class 3 Stockpile
Sample 1206
γd = 1.97 Mg/m3
γ = 1.23 Mg/m3
d
8
20
6
4
10
2
2
4
6
8
10
12
0
6
8
0
2
4
10
12
Temperature (C)
Temperature (C)
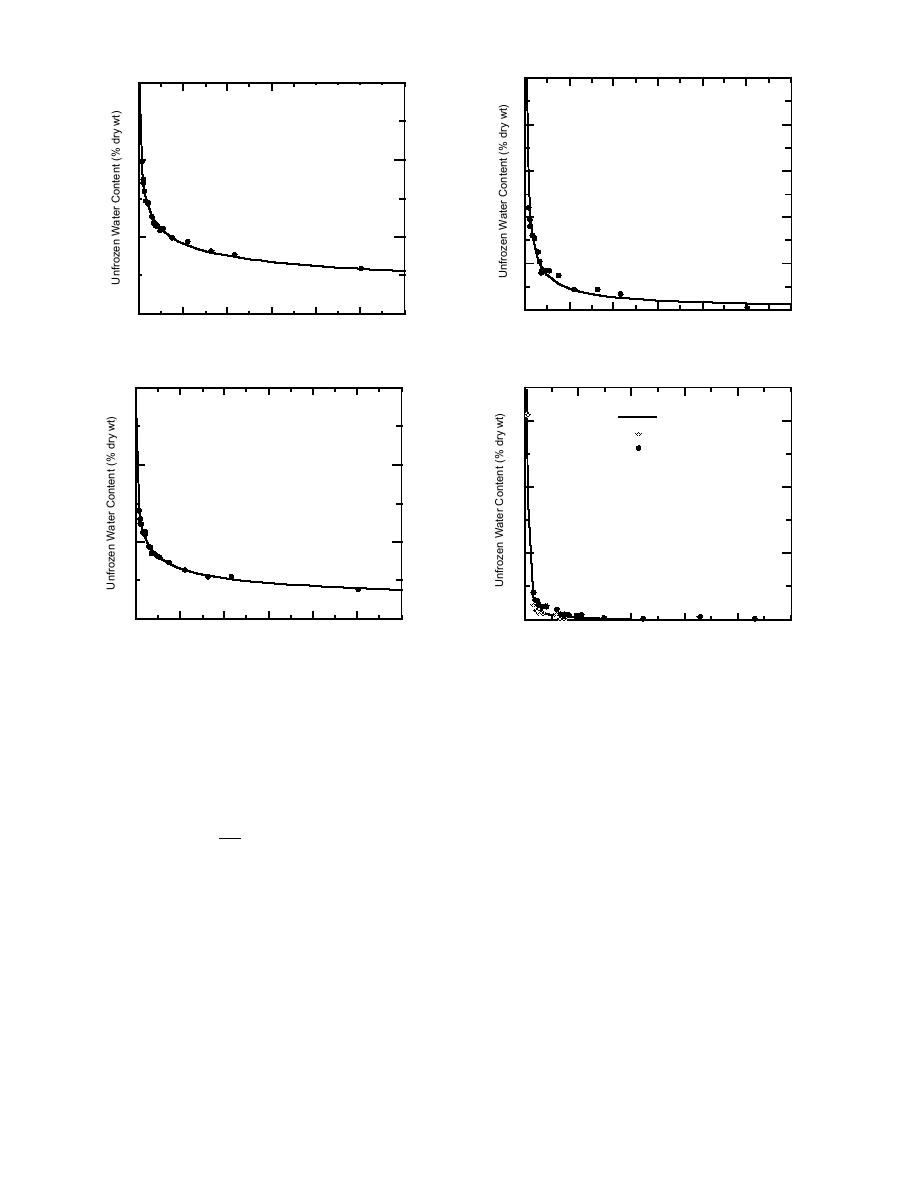
c. Class 3 stockpile.
a. Subgrade sample 1206.
30
Sample 1232
Class 6 Stockpile
γd = 1.53 Mg/m3
Calculated
30
+ No. 30; γd = 1.70 Mg/m3
- No. 30; γd = 1.85 Mg/m3
20
20
10
10
0
2
4
6
8
10
12
0
1
2
3
4
5
Temperature (C)
Temperature (C)
d. Class 6 stockpile.
b. Subgrade sample 1232.
Figure 13. Temperature vs. gravimetric unfrozen water content curves. Solid lines represent calculated
values used in the modeling.
the mechanistic procedure, produced with an equa-
Resilient modulus
tion in the form:
Laboratory resilient modulus tests were con-
ducted using repeated-load triaxial test procedures,
β
-T
the full details of which are described in Berg et
wu- g = α
; T < 0C
(4)
T0
al. (1996) and in Cole et al. (1986, 1987). The
tests involve applying a confining pressure to a
where wug = gravimetric unfrozen moisture con-
cylindrical specimen within a cell, while subject-
tent, %
ing the specimen to cyclical loading of a deviator
T = temperature, C
stress.
T0 = 1.0C
α, β = constants.
Test procedures--Mn/ROAD materials
The materials tested included the two extreme
Table 9 contains the constants determined for each
gradations of base--class 6 special and class 3
sample. Additional details about the procedure and
special, and the 1206 and 1232 subgrade samples
test results are in Bigl and Berg (1996a).
that represent, respectively, the high- and low-heav-
17


 Previous Page
