to be an effective polarizer of traverse UHF and
PBrine
Fresh Ice
P
ockets
Brine
VHF electromagnetic waves. This ice structure
latelet
Gas
b
a
may have been the reason for the conductivity
anisotropy noted in Figure 5 and the related ice
thickness offset shown in Figure 9. Nine conduc-
Columnar
I
tivity measurements were made on new lead ice
ce
d
Z
Root
with the EMI's boom aligned parallel and then
one
perpendicular to the preferred sea-ice c-axis crys-
c
al
s
tal direction, and two measurements were made
Ba
ne
~ SK Ice
at ~45 to the preferred c-axis alignment, as deter-
Dc-axis
a
Pl
1 to 5 cm
irection
mined from ice core samples. The conductivity
measurements, without gain correction, are listed
in Table 1. The data clearly indicate a strong con-
ductivity anisotropy at this location when the EMI
was rotated on the ice. But, when the instrument
a≤b<
c
was elevated 1 m above the ice surface at sites 2
a ~ 0.1 to 0.3 mm; b ~ 1 to 5 a; c > 5 a
and 3 and the measurements repeated, the con-
F
d ~ 0.25 to 1.25 mm (avg 0.7)
ductivity anisotropy was not discernible. While
rozen Interface
this field program was not intended to explore
Seawater Interface
sea ice anisotropy using the EMI, the limited field
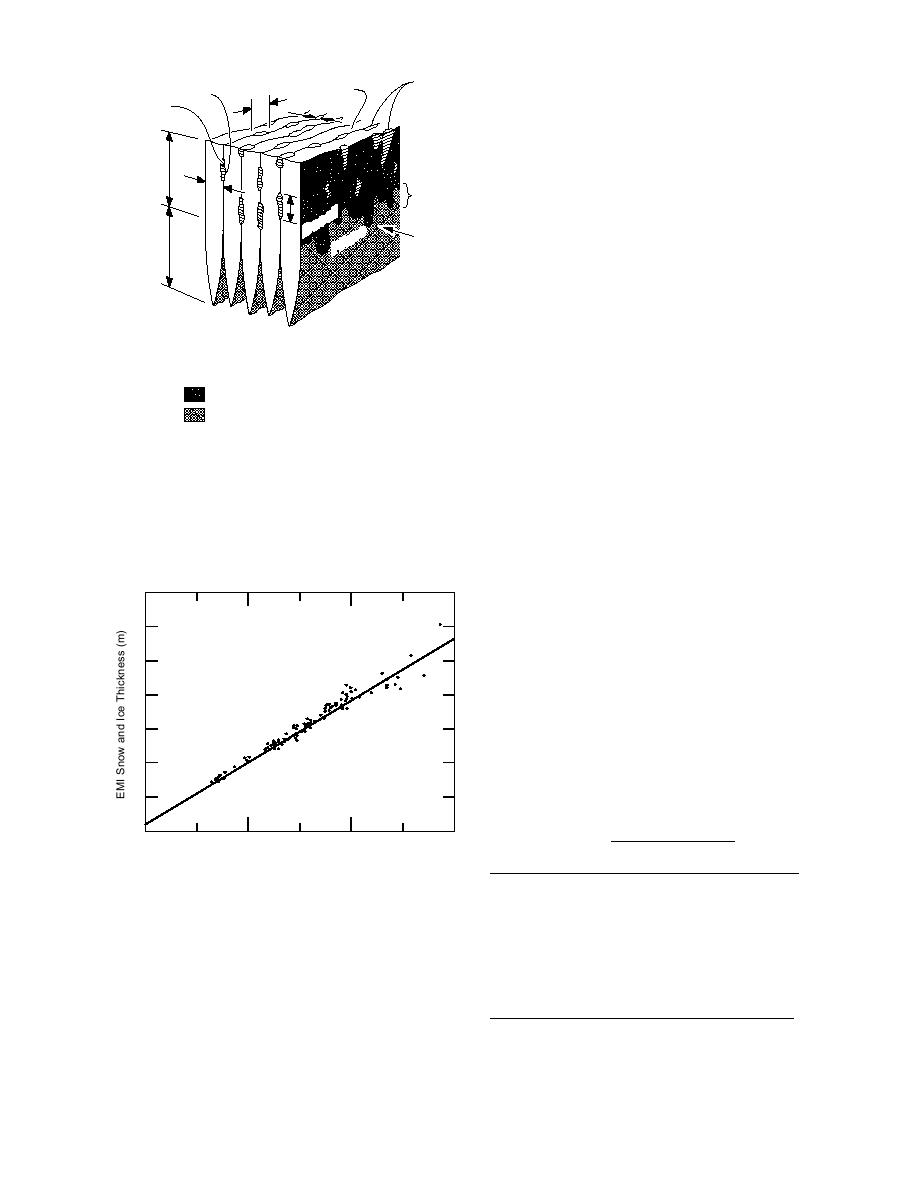
Figure 8. Model of the sea ice crystal structure, show-
measurements do suggest that the sea ice struc-
ing the transition from columnar ice to the skeletal
ture may have affected the apparent ice conduc-
(SK) layer at the bottom of an ice sheet. The root zone
tivity measurements and therefore the ice thick-
depicts the uneven contact between ice platelets in the
ness estimate. Further study should resolve this
zone of platelet separation. The brine pockets are shown
issue.
to vary in size and shape but are always located along
A one-to-one curve was passed through the
data presented in Figure 9 along with 5% devia-
the basal plane between the fresh ice platelets.
tion limits as shown in Figure 10. As may be
inferred from Figure 10, the EMI ice thickness
7
determination for the most part fell within the 5%
variation of the drill hole measured snow and ice
y = 0.20 + 0.92x
6
thickness measurements up to about 4.5 m. Above
r 2 = 0.970
4.5 m the undulating ice relief and therefore the
5
ice thickness in the area of the drill hole probably
adversely affected the correlation between the EMI
4
and drill hole measurements.
3
2
Table 1. Apparent conductivity vs. EMI boom
1
alignment with the preferred c-axis alignment.
Conductivity (mS/m)
0
2
4
6
Thickness*
Boom
Boom
Boom
Drill Hole Measured Snow and Ice Thickness (m)
@ 45
Site
(m)
parallel perpendicular
Figure 9. EMI determined vs. drill hole measured snow
1
0.48
838
855
840
and ice thickness.
2
0.48
870
880
3
0.43
878
893
flected energy from the ice bottom is recorded.
4
0.43
860
875
However, when the antenna is oriented perpen-
5
0.45
870
880
dicular to the preferred c-axis direction, the re-
6
0.45
860
875
7
0.45
840
860
852
flected energy was significantly reduced or elimi-
8
0.46
840
855
nated (Kovacs and Morey 1979).
9
0.47
838
855
The ordered ice platelet structure at the bot-
tom of the thick (>0.5 m) sea ice has been shown
*Drill hole measured snow and ice thickness.
6


 Previous Page
