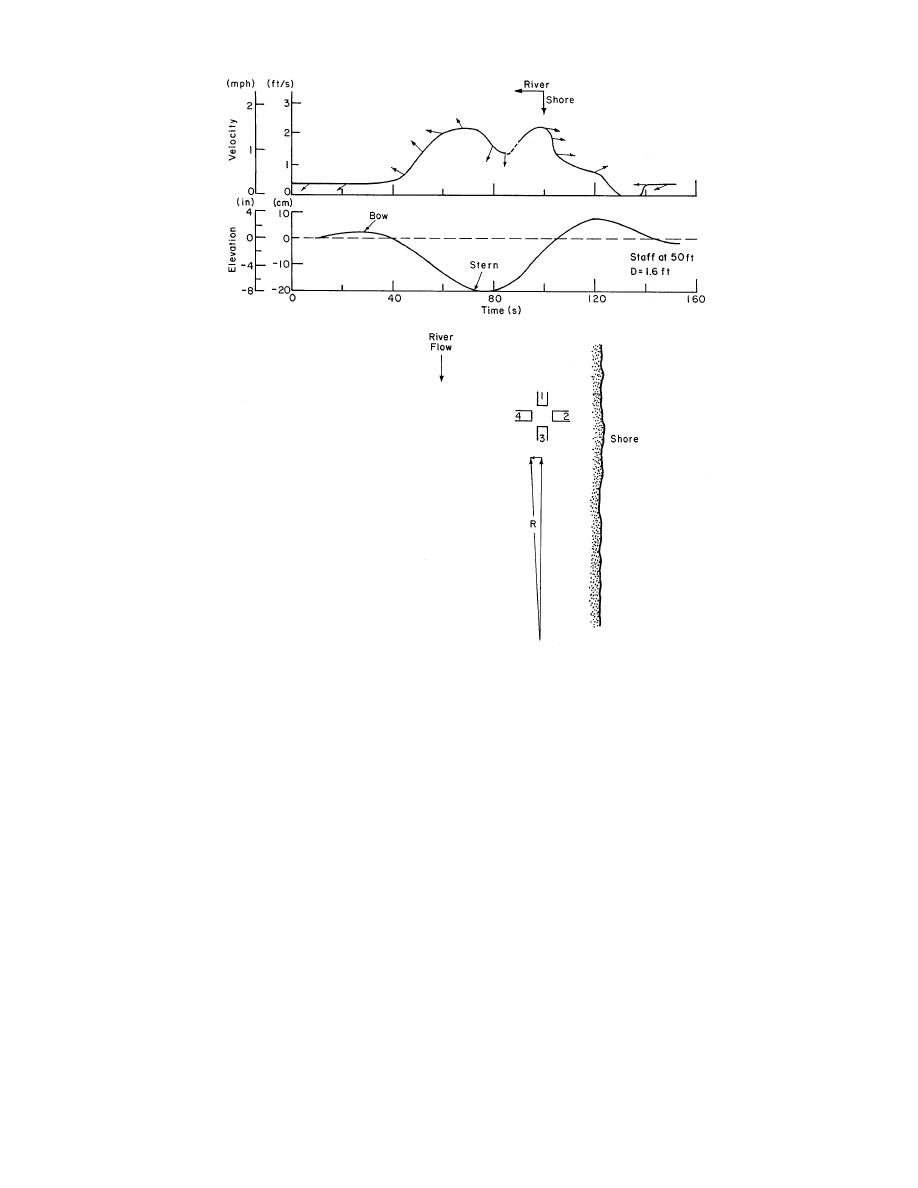
Figure 6. Velocity, water surface elevation and sediment movement measure-
ments during vessel passage. (After Alger 1978.)
sage presented in Figure 6, so that all transport
However, natural currents, a sloping bottom and
should be ship induced. The direction of net trans-
the intensity and duration of vessel-generated
port has been found to be sensitive to the charac-
currents can combine to cause net transport in
teristics of a specific site, the vessel direction and
almost any direction. Figure 6 shows velocity and
the magnitude of the drawdown event. In this
stage measurements for a vessel passing Nine Mile
case the net transport was primarily upstream and
Point on the St. Marys River at 10 mph (Alger
slightly offshore, as indicated by the vector R in
1978). In the velocity graph the axes define the
Figure 6.
magnitude of water velocity with time, while the
Further data on sediment transport during
direction of water movement at any particular
vessel passage can be found in Alger (1978,
time is indicated by the superimposed arrow.
1979a,b) and Hodek et al. (1986). The data analy-
Sediment transport was also measured dur-
sis by Hodek et al. showed that downbound ships
ing that event using an array of four traps ori-
ented in 90 increments. The traps had been set
caused much less sediment transport than
upbound vessels at comparable drawdowns. It
for a 20-minute period prior to vessel passage,
also showed that upbound vessels creating a draw-
and no sediment was collected in any of the traps.
down of 6 in. or less cause relatively little distur-
On a different date the traps were set during a
bance. For data indicating net transport, 83% of
period with wind-driven waves of about 1-ft
upbound ships and 70% of downbound ships
amplitude, and all traps collected some sediment.
caused net offshore movement.
There were no wind waves during the vessel pas-
9


 Previous Page
