centrifuge. Manual operation was necessary be-
8-g and 32-g tests along with the corresponding
cause of the crude response of the centrifuge's
1-g prototype values calculated using either the
refrigeration control system. The duration of the
Table 1 scale factors or the scaling process de-
experiments was approximately five hours. A ther-
scribed in Appendix B. The temperature records
mocouple located at the top of the closed centri-
reveal that the chamber temperature varied by
0.25C from the desired temperature of 2C.
fuge chamber provided the only temperature
measurement for the tests. There was no measure-
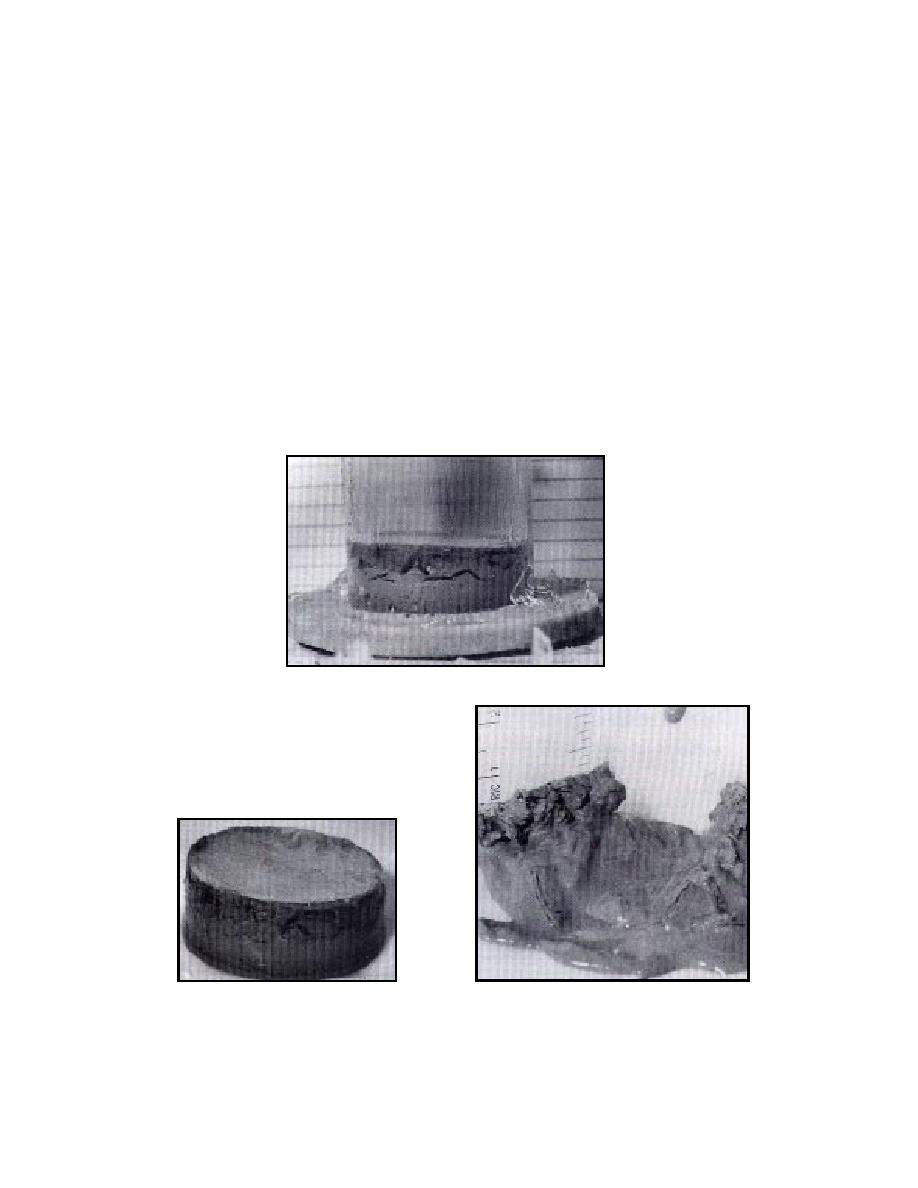
Figures 4 and 5 show the 8-g and 32-g samples,
ment of the temperature of the sample. In addi-
respectively, before and after their extrusion from
tion there was no measurement of the sample
the cylinder and after crudely cutting them to
heave as a function of time.
examine the interior ice lens configuration. The
air temperature surrounding the samples during
cutting was 4.5C. As a result the figures show
the samples in progressive stages of melting.
RESULTS
In the five-hour test period, only the upper 5
The experimental data consist of measurements
8 mm of the 8-g and 32-g samples froze. This was
of the temperature in the centrifuge chamber, mea-
a desired result, as it confirms that the freezing
surements of the height of the samples at the be-
occurred from the top down. This was important
ginning and end of the tests, and observations
since we had no other means of monitoring the
and photographs of the samples following the
progress of the freezing front. That the 8-g and
tests. Table 2 presents the measurements for the
32-g samples would freeze to about the same depth
a. Prior to extrusion from the cylinder.
b. After extrusion from the cylinder.
c. After cutting to examine the interior ice lens
configuration.
Figure 4. Sample used in the 8-g experiment.
5


 Previous Page
