APPENDIX C. TRACTION COEFFICIENTS ON PACKED SNOW
Traction on groomed, shallow snow was measured with three different vehicles-- the CRREL Instru-
mented Vehicle (CIV), the Saab Friction Tester and the Uniroyal-Goodrich Traction Tester (U-G)--in Shoop
(1993a). Several methods of reporting the traction coefficient () were used:
The maximum value (max);
An average peak value (peak);
The value at 12% slip (12%slip); and
The SAE-specified (SAE).
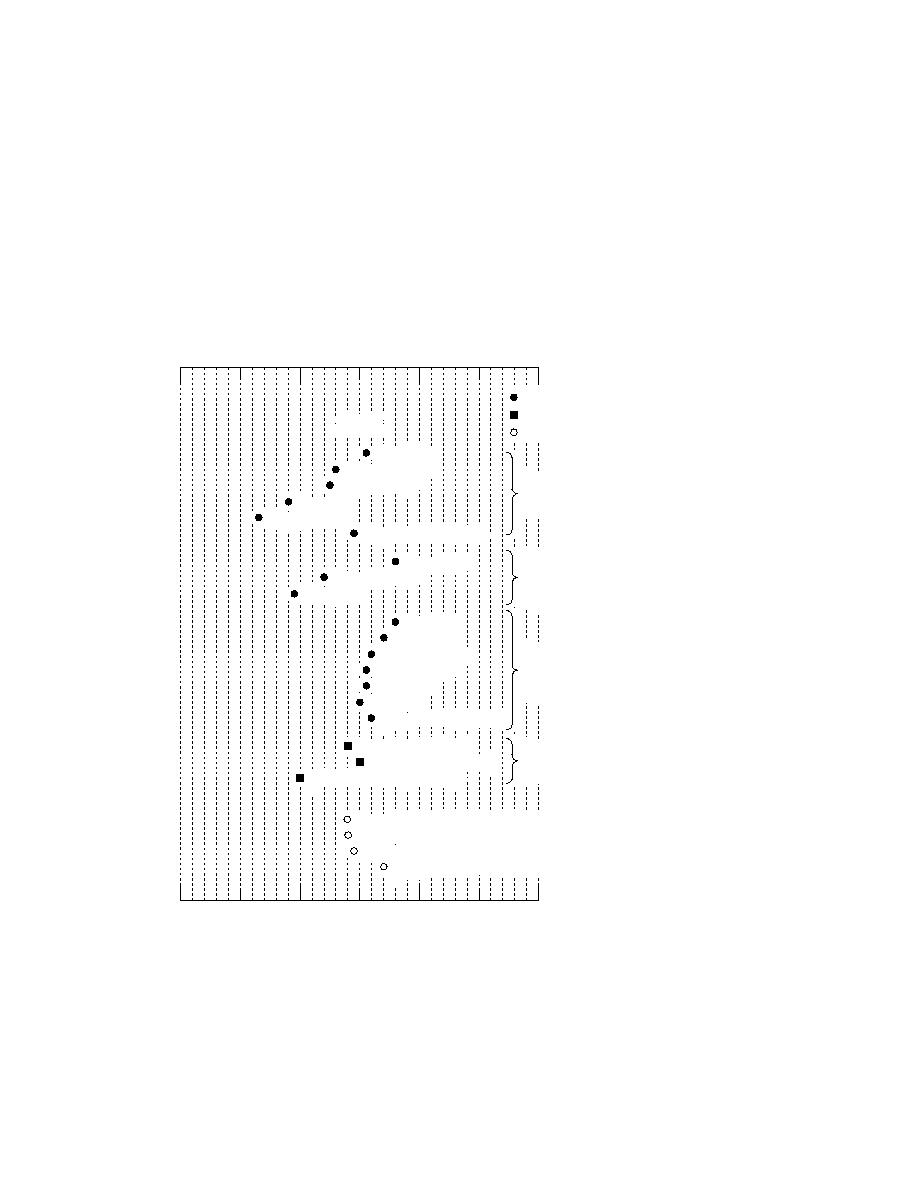
These measurements are compared to other published traction coefficients on groomed snow in Figure
C1. The predicted traction values, using CRREL's Cold Regions Mobility Models, is expressed in coeffi-
cient form and is shown by the open circles at the bottom of the figure.
Data from Shoop 1993
Pata from Richmond et al. 1990, SME 1977
now
S
redicted Gross Traction
CIV Max
CIV Ave. Peak
CIV 12% Slip
2
Snow Road
S.5 cm, 0.25 g/cm 3
CIV SAE
now over Hard Pack
Saab 12% Slip
CIV Ave. Peak (gross)
U - G Max
1
Snow Test Section '92
S0 cm, 0.54 g/cm 3
Saab 12% Slip
( now over Hard Pack
U - G SAE
Tair = 2 C, Tsnow = 1 C)
CIV Max
U - G Max
CIV Ave. Peak
2
Snow Test Section '93
S cm, 0.59 g/cm 3
CIV 12% Slip
( now over Hard Pack
U - G SAE
Tair = 0.6 C, Tsnow = 2.8 C)
CIV SAE
CIV Ave. Peak (gross)
CIV Ave. Peak (net)
a cm,0.59 g/cm 3 Groomed
6
CIV Ave. Peak (gross)
( nd Packed Snow
Richmond et al., 1990).
Packed Snow (SME, 1973)
Saab Predicted, Hard Packed Snow
CIV Predicted, Hard Packed Snow
Saab Predicted, Undisturbed Snow
CIV Predicted, Undisturbed Snow
0
0.2
0.4
0.6
Traction Coefficient ()
Figure C1. Comparison of measured, published and predicted values of traction on shallow
groomed snow.
53


 Previous Page
