1994 Arctic Ocean Section
60
on the upwind side of the ship, away
from ship stack emissions and other
sources of contamination. The samples,
collected on cartridges, were kept fro-
zen until analysis (usually within 48
40
hours of collection). DMS was thermal-
ly desorbed from the sample cartridges
by placing the cartridges in the injector
of a gas chromatograph. The DMS was
20
then transferred to the analytical column
for separation and determined quanti-
tatively by a flameless sulfur chemilumi-
nescence detector. Samples collected
0
20
40
60
80
100
from 18 July to 8 September showed
Ice Cover (%)
atmospheric concentrations from less
than 0.25 nM/m3 (the detection limit) to 50.7 nM/m3, with a median value
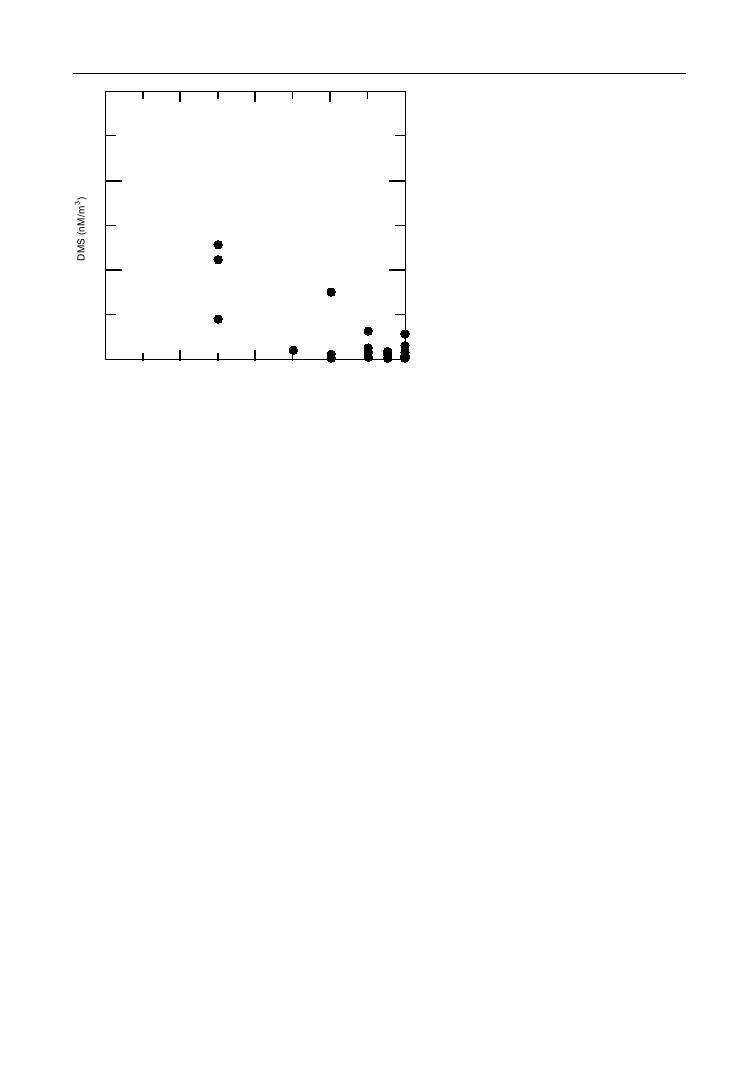
Variation of atmo-
spheric dimethyl
of 1.95 nM/m3.
sulfide as a function
The highest DMS concentrations were found near the ice edge at 6770N,
of ice cover.
in the Bering Strait and Chukchi Sea regions, and the levels decreased as a
function of ice cover as the ship moved into higher latitudes. This pattern
reversed as the ship exited the ice pack into the Greenland Sea, consistent with
results from the Oden expedition. A diurnal variation was observed in open
water areas, with samples collected at night having values up to four times
higher than in the samples collected during the day in the lower latitudes.
There was not much variation in the ambient concentration once the ship
moved well into the ice pack, but most of these samples were below or just
above the detection limit of the analytical system.
To identify source areas of chemical constituents in the air, we calculated
Langrangian back-trajectories and applied them to the data to determine the
path of air parcels reaching the sampling stations. The most frequent source
area was the northwest Pacific Ocean via the Bering Strait and Chukchi Sea.
Many back-trajectories showed that the air was representative of the high Arc-
tic and had been within this region for several days. A third group of trajectories
showed air originating near Greenland and Iceland.
These results are in agreement with earlier findings on the distribution of
dissolved and atmospheric DMS in the eastern Arctic. Not only was the aqueous-
phase DMS low in the ice-covered central Arctic Ocean, but oceanatmosphere
exchange is inhibited by the presence of the ice pack. However, the data avail-
able from this complete transect of the Arctic Ocean basin clearly demon-
strate that the distribution of DMS along the ice margin and in nearby open
ocean areas is asymmetric. In particular, atmospheric DMS concentrations
were up to ten times higher in the Bering Strait and Chukchi Seas than in the
eastern Arctic.
50


 Previous Page
